Download
1 / 48
490 likes | 719 Views
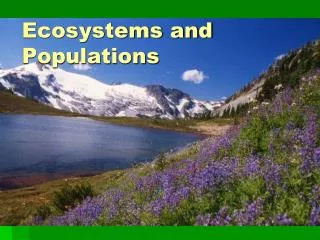
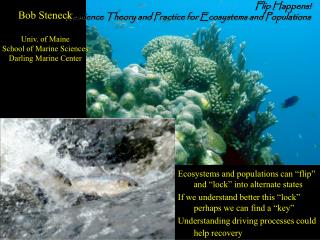
Flip Happens! Resilience Theory and Practice for Ecosystems and Populations. Bob Steneck Univ. of Maine School of Marine Sciences Darling Marine Center. Ecosystems and populations can “flip” and “lock” into alternate states If we understand better this “lock” perhaps we can find a “key”

E N D
Flip Happens! Resilience Theory and Practice for Ecosystems and Populations Bob Steneck Univ. of Maine School of Marine Sciences Darling Marine Center • Ecosystems and populations can “flip” and “lock” into alternate states • If we understand better this “lock” perhaps we can find a “key” • Understanding driving processes could help recovery
1973 Holling observed that ecosystems can change suddenly and are “profoundly influenced by changes external to the ecosystem and continually confronted by the unexpected.” Engineering vs Ecological Resilience Engineering resilience relates to the stability around an equilibrium stead state. A metal spring deforms but when pressure is relaxed it returns to its initial shape. Ecological resilience is the amount of disturbance an ecosystem can withstand without changing and if changed it may not rebound to its previous state (ie can “flip” to an alternative stable state).
Ecosystems can “flip” to a “contrasting state” Caribbean reefs Aleutian kelp forests Black Sea Hughes et al 2005
Ecosystems can “flip” to a “contrasting state” We are often surprised by these “flips” First, the bigger picture on “sudden transitions” Caribbean reefs Aleutian kelp forests Black Sea Hughes et al 2005
He was interested in time, walking his anteater and his impending BIG transition (The Swallow’s tail)
Salvador Dali’s last painting (1983) “Catastrophe fold diagram” Scheffer and Carpenter 2003 Dali was interested in catastrophe theory. “The Swallow’s tail” was to illustrate his pending transition from life to death…
“Alternative Stable States” and Catastrophic Bifurcations Scheffer et al 2001
“Alternative Stable States” and Catastrophic Bifurcations “Threshold” or Catastrophic bifurcation “Hysteresis” Ecosystem Driver
As “conditions” or “drivers” change so do “Ecosystem States” Monotonic change Threshold Threshold with hysteresis Or “catestrophic fold Scheffer 2009
Lake Eutrophication Example Scheffer et al 2001
Lake Eutrophication Example Scheffer et al 2001
Lake Eutrophication Example (Showing Feedback Mechanisms) Ecosystem State Conditions or Drivers Scheffer et al 2001
Sudden transitions and “Hysteresis” in a nutshell……. When you add the straw that breaks the camel’s back (ie reach a threshold)…. The break occurs suddenly (often a surprise) 2. Removing that straw, will not heal its back (ie. hysteresis)
Jamaican Reef Flips Suddenly 1988 Phase shift to macroalgae Same coral Shallow 1978 Mid-depth
} Coral Dominated “Phase shift” } Coral Depleted What controls “Hysteresis”? “Alternative Stable States” and Catastrophic Bifurcations Coral Reef Ecosystems Ecosystem Driver Which ecological processes control “key” ecosystem drivers?
R2= 0.74 Bonaire, NA Calabash, Belize Carrie Bow, Belize Cayos Cachinos, Honduras Glovers, Belize Guatemala 0 500 1000 1500 2000 2500 3000 Increasing Algal Biomass Algal Abundance & Baby Coral Densities Caribbean-wide Study Regions 3 2.5 2 No. juvenile corals per 1/16m2 1.5 1 0.5 0 Algal Biomass (Algal Index Proxy)
Alternative Ecological States (too little grazing) Reduced structural complexity Reduced fish recruitment Reduced coral cover Reduced grazing intensity Increased macroalgal cover Coral recruitment decline POSITIVE FEEDBACKS NEGATIVE FEEDBACKS (sufficient grazing) 2008 Increased fish recruitment Increased structural complexity Increased coral cover Increased grazing intensity Feedback Loops Coral recruitment increased Reduced macroalgal cover Locked into an coral depleted state
NEGATIVE FEEDBACKS (too little grazing) Reduced structural complexity Reduced fish recruitment Reduced coral cover Just focus on the recovery loop Increased macroalgal cover Coral recruitment decline 2008 Reduced grazing intensity Feedback Loops Locked into an coral depleted state
} Coral Dominated } Coral Depleted Algae controls “Hysteresis”? “Alternative Stable States” and Catastrophic Bifurcations Coral Reef Ecosystems Algal Biomass an Ecosystem Driver algae locks reefs in coral-depleted state
Ecosystem State Changing Stability Landscapes Alternative Stable States (basins of attraction) Lock into new state
Bad drivers Good drivers Good results (fewer surprises) Bad (often surprising) results Can we learn to recognize good vs bad drivers?
Types of Drivers: Strong drivers within ecosystems (phase shifts) Strong drivers extrinsic to the ecosystem (regime shifts)
5 4 3 2 1 0 1960 1965 1970 1975 1980 1985 1990 1995 2000 Gulf of Maine (Sea urchins = strong driver) Urchin Fishery Coastal cod extirpated 1930s - 1940 Kelp Forests Patchy ABUNDANCE INDEX Steneck et al 2002
300 180 160 200 140 Sea Urchin Abundance (g/m2) Seaweed Seaweed Abundance (% cover) 120 100 100 80 Urchins 0 60 1993 1994 1995 1996 1997 1998 1999 2000 2001 York
300 180 160 200 140 Sea Urchin Abundance (g/m2) Seaweed Abundance (% cover) Seaweed 120 100 100 80 Urchins 0 60 1993 1994 1995 1996 1997 1998 1999 2000 2001 Phase Change to a new “Stable State” The “Lock” .
20000 15000 10000 5000 0 1995 1996 1997 1998 1999 2000 2001 York High Larval Settlement # Settlers Per Square Meter Pemaquid Mt. Desert Jonesport Years Vavrinec Ph.D.
Crab Micropredator Mechanistic understand of the “lock”
Physically Driven Regime Shift (Coral Reef Example) Photo: Bob Steneck, UM
> 50% decline in all reef fish due to reduced receptivity of the habitat
“Regime Shifts” are usually physically forced North Pacific Example Scheffer et al 2001
Gulf of Alaska Regime Shift (Anderson & Piatt 1999)
Density Dependent Processes: Single Species Examples Classic fisheries population dynamics Scheffer 2009
The “Allee Effect” Density dependent controls on per capita growth rate of a population Note: Negative growth at very low and very high population densities Due to different driving processes Intrinsic rate of population growth such as low reproductive success at low population densities and competitive disadvantages at very high population sizes
Allee effect examples Trees too few to support pollinating insects Tuna too few to fertilize all eggs Colonies of insects too small to fertilize the queen Kakapoo too rare to find a mate African wild dogs are obligate cooperative breeders so when sparse they can lose their reproductive potential Also very common among fishes
Density Dependent Processes & Allee Effect: Single Species This is a “lock”
Closures (MPA’s) Established Foreign fishing fleet excluded US fishing fleet gears up Atlantic Cod on Georges Bank
Spawner biomass of Newfoundland’s northern cod Targeted fishing ceased in 1992 Closed to cod fishing Little to no recovery: a lock? 1962
Applications to Diadromous Fish: Most I suspect are ecosystem passengers rather than ecosystem drivers Most will likely be more affected by extrinsic changes to their habitat BUT, they have two habitats affecting their demography Do they show patterns of “flip” and “lock”? If so, what could be the threshold mechanisms?
Alewives: Three Rivers in Maine A flip? Spencer 2009
Alewives: Three Rivers in Maine All three rivers had different histories of management and watershed alterations Spencer 2009
Flip happens….. How can we be good doctors at diagnosing and treating management problems of complex systems? Symptoms to look for: Complex ecosystems and populations can flip Look for sudden transitions Look for driving processes Look for feedback mechanisms that maintain locks • Ecosystems and populations can “flip” and “lock” into alternate states • If we understand better this “lock” perhaps we can find a “key” • Understanding driving processes could help recovery
Thank you! Thank you! Thank you