Download

1 / 43
430 likes | 554 Views
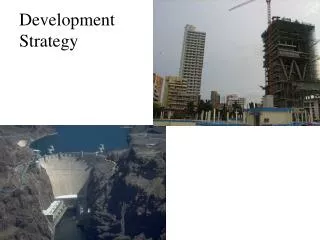
Development Strategy. 2009. Pattern of Development. Data for International Comparisons. World Bank World Development Indicators

E N D
2009 Pattern of Development
Data for International Comparisons • World Bank World Development Indicators • Original developers of ICP working at University of Pennsylvania maintain historical dataset on expenditures called Penn World Tables ( Link ) Much longer historical data and somewhat more detailed than WDI
Patterns of Economic Growth • Developed Economies experienced a golden age of per capita GDP growth during post-war period but have experienced slower growth since 1973 • Many developing economies also experienced fast growth during 1950-1973 but slowed markedly during 1973-1998. Some developed economies (India, Africa) have experienced a growth resurgence since then.
GDP per Capita vs. Productivity • Per Capita GDP can be broken down into two parts: GDP per Capita Productivity GDP per Labor Unit Employment Rate Labor Unit per Capita = X
GDP per Capita vs. Productivity • Employment can itself be broken down Employment Rate Labor Unit per Capita Hours per Employee Employed per Labor Force X = Labor Force per Working Age Population Working Age Population per Population X X
Productivity Data • Key source for international comparisons in productivity is the Total Economy Database • Originally developed at University of Groningen Growth and Development Centre. Link Total Economy Database Link
Main Differences in Countries are Due to Variation in Labor Productivity
Productivity Catch Up: EuropeSource: Groningen Growth & Development Center 2009 Intl$, GDP per Hour Worked (Y/L)
Productivity Catch Up: East AsiaSource: Groningen Growth & Development Center 2009 Intl$, GDP per Hour Worked (Y/L)
Productivity Catch Up?: Latin AmericaSource: Groningen Growth & Development Center 2009 Intl$, GDP per Hour Worked (Y/L)
Basis of ProductivityA. Factor Endowments • 1. Natural Resources: Income from resource extraction can technically lead to higher GDP per hour…..
Resource Curse • Some scholars argue that countries “blessed” with large endowment of mineral resources suffer slow growth. • Creates social conflict over control of natural resources. • Leads to poor institutions • Ex 1. Conflict Diamonds Link
Ex. 2. Nauru (pop. 8000) Link Significant deposits of phosphates and small population made this one of the wealthiest societies in world in 1970’s. But phosphates ran out.. • Country never developed internal sources of productivity unemployment rate 90% • National gov’t corrupt and wasteful, bankrupt and completely dependent on multinational aid
Is the resource curse true? • Recent studies question these results Link , but findings suggest that positive productivity spillovers to non-resource industries are questionable. • Natural resources can be shipped across borders particularly using
2. Capital Stock • Capital Formation – Stock of equipment, machines, structures per worker. • Capital investment is a central part of advancing productivity in developing economy but displays diminishing returns.
Measuring Capital ReturnsICOR Incremental Capital –Output Ratio: Ratio of constant dollar investment to increase in output • Measures number of dollar of investment needed to produce an extra dollar of output. LINK • ICOR is volatile, must take long run averages.
3. Human Capital • Measures skill, education level of the work force. • General (broad primary & secondary education & health) or specific skills (technical skills obtained at tertiary level).
By 2005, average in 25-29 cohort was 12.2 yrs compared with 13.4 years in USA http://www.barrolee.com/
B. Infrastructure http://data.worldbank.org/data-catalog/world-development-indicators
http://data.worldbank.org/data-catalog/world-development-indicatorshttp://data.worldbank.org/data-catalog/world-development-indicators
Capacity for scientific advance measurable along a number of dimensions. D. Technology Capacity
http://www.uspto.gov/web/offices/ac/ido/oeip/taf/reports.htm
Structuralist Theory • Structure of developing economies is different. More heavily concentrated in primary industries. • UNCTAD Economist Raul Prebisch developed the idea that primary products would fall in value relative to manufactured goods. Link • Need government intervention to shift toward secondary sectors.
Import substitution: • Use of tariffs and trade restrictions to develop domestic manufacturing sector • Wealthy countries dominate large-scale capital intensive sectors. Government must coordinate expansion of heavy industry. Example: India Link • Criticism: This led to development of low productivity high cost manufactured sector protected from international competition. Link - Krueger.
Comparative Advantage & Gains from Trade Link • Two countries with different levels of development can gain by concentrating on industries to which they are best suited. • More advanced country can still gain by concentrating on its best performing industries and shift production of relative worse performers. • Less industrialized countries typically have advantage in labor intensive industries since labor is abundant and cheap.
Washington Consensus • Fiscal Discipline.- Balanced Budget. • Reordering Public Expenditure Priorities. Eliminate biased subsidies, increase health, education and infrastructure. • Tax Reform. Broad tax base with moderate marginal tax rates. • Liberalizing Interest Rates • Competitive Exchange Rate http://www.iie.com/publications/papers/williamson0904-2.pdf
Identified as a consensus for development by policymakers in Washington (World Bank, IMF) and particularly Latin America. • Trade Liberalization • Liberalization of Inward Foreign Direct Investment. • Privatization. • Deregulation. specifically on easing barriers to entry and exit. • Property Rights
Foreign Direct Investment Two key elements need to be emphasized in the definition of FDI: • long-term nature or of “lasting interest.” • the investor has a “significant degree of influence” on the management of the enterprise. For operational purposes, 10 per cent of the voting shares or voting power is the level of ownership necessary for a direct investment interest to exist (IMF, 1993, paragraph 362; OECD, 2008, paragraph 117) UNCTAD Training Manual on Statistics for FDI and the Operations of TNCs Volume I FDI Flows and Stocks LINK
Pro’s and Cons of FDI Pro: • Increased domestic capital formation. • FDI brings superior technology • Increases domestic competition • Gives access to export markets. • FDI more stable than loans or capital flows. • Con: • Multinationals may interfere with local political economy. • Foreign nationals fill top jobs. Link #1 Link #2
Pillars of East Asian Growth MiracleWorld Bank Chief Economist View • Economic and Social Stability • Strong Bureaucratic State to Promote Growth • Financial repression to promote corporate investment • Broad based, technical education • Allocation of Resources to Export Industries • Access to Credit & Foreign Exchange • Performance based • Learn international standards and technology • Attract FDI
New Structuralist DevelopmentStrategyNew Structural Economics by Justin Lin • Countries have grown more developed by: • Focusing on areas of comparative advantage • Investing in physical and human capital. • Changing Structure of Industry as capital formation changes comparative advantage (toys to clothes to electronics to cars to tech). • Public sector involvement in co-ordination of structural upgrades.
Industrial Policy • All economies have industrial policy, through tax code, through infrastructure spending, through setting of national goals. • Should think about industrial policy rationally instead of haphazardly. Elements of Successful Architecture • Political support from top leaders. • Mechanisms of public\private communication. • Mechanisms of transparency and accountability.
Industrial Policy for 21st CenturyDaniRodrikLink • Development is the process of creating new industries, not only upgrading but diversifying. Two roles for government • Pioneer firms take risks entering into new industries, generate information about which sorts of products an economy is good at, but this can be copied by competitors. • Industries rely on a network of suppliers and supporting industries. Building a new industry might require co-ordination.
Midterm Exam • Tuesday, October 30 • Regular Class Time 1:30-2:50 • Coverage - Material through October 25th • Format – Similar to practice exam; Semi-open book: one page A4 size handwritten notes . • Place: Family Name A-L: 4033; Family Name M-Z: 4030.