Download
1 / 2
20 likes | 155 Views
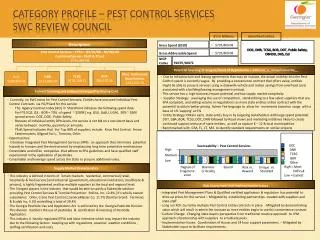
Category Profile – pest control services SWC Review Council . $’s in Millions. Identified Entities. Description. DOC, DNR, TCSG, BOR, DOT, Public Safety, DBHDD, DHS, DJJ. $735,869.08. Gross Spend (2010). $735,869.08. Gross Addressable Spend.

E N D
Category Profile – pest control services SWC Review Council $’s in Millions Identified Entities Description DOC, DNR, TCSG, BOR, DOT, Public Safety, DBHDD, DHS, DJJ • $735,869.08 Gross Spend (2010) • $735,869.08 Gross Addressable Spend Pest Control Services – FY10 – (07/01/09 – 06/30/10) Combined Spend – PSoft & PCard $735,869.08 91059, 98872 NIGP Codes Potential Sourcing Strategies/Areas of Opportunity – SPD Led_ x_ Coop/Consortia__ BOR$86,137.30 TCSG $118,149.21 Misc. Authorized State Entities $151,531.70 DNR $171,096.58 DOC$208,954.29 • Due to Infrastructure and leasing agreements that may be in place, the actual visibility into the Pest Control spend is currently vague. By providing a convenience contract that offers value, entities might be able to procure services using a statewide vehicle and realize savings from overhead costs associated with a building/leasing management contract. • This service has a high business impact potential and low supply market complexity • Supplier Strategy: Leveraging the use of competition, standardizing to a few select suppliers that are EPA compliant, and selling volume in negotiations as more state entities utilize contract with the potential to obtain better pricing. Admin Fee language to allow for increments based on usage with a base of 1% ‘capping’ at 5% • Entity Strategy: Obtain early state entity buy-in by targeting stakeholders with large spend potential: DOT, GBA, BOR, TCSG, DOC, DNR followed by Road shows and marketing initiatives likely to create continued support and use of state entities, as well as capture K – 12 & local municipalities • Benchmarked with GSA, FL, CT, MA to identify standard requirements on similar projects Current Sourcing and SciQuest Strategy/Purchasing Card • Currently, no SWC exists for Pest Control Services; Entities have procured individual Pest Control Contracts via PO/PCardfor this service • The Agency Contract Index (ACI) in SharePoint indicates the following spend data: • For FY10 Q2, Q3 : BOR = 70% of spend ~ $200K [ e.g. GSU, GaSU, UGA], 30% ~ $30K spread across DOC, DOE, Public Safety • Because of individual entity DPA levels, the service is not bid on a consistent basis and varies between monthly, quarterly or annually • PSoft Spend indicates that the Top 80% of suppliers include: Knox Pest Control, Arrow Exterminators, Allgood Svc’s, Terminix, Orkin • Opportunities: • Introduce Integrated Pest Management Services (IPM): an approach that minimizes potential hazards to humans and the environment by emphasizing long term preventive maintenance • Consolidate and utilize companies that adhere to EPA guidelines and have qualified staff experienced in the application of pesticides. • Consolidate and leverage spend across the State to procure additional value. DOC DNR TCSG BOR Other High = Most Difficult Low = Easiest Sourceability – Pest Control Services High Medium Low Degree of Fragment-ation Business Criticality Spend Supply Market Characteristics Risk vs. Reward Unique vs. Standard • This industry is defined in terms of 3 main markets: residential, commercial [retail, hospitality & food service ]and industrial [government, educational institutions, healthcare & prisons], is highly fragmented and has multiple suppliers at the local and regional level. • The 3 largest players in the industry that would be able to satisfy a Statewide solution providing Pest Control Services & Termite Prevention: Rollins, Inc. 12.4% [ it’s wholly owned subsidiaries: Orkin, Crane Pest Control ]; ServiceMaster Co. 11.7% [familiar brand: Terminix] & Ecolab Inc. 5.3% controlling a total of 29.4% • The Georgia Pesticide Use and Application Act is enforced by the Georgia Pesticide Division: This division monitors the use of pesticides & certification & licensing of Pesticide Applicators. • This industry is heavily regulated (EPA) and labor intensive which may impact the industry due to the following factors: keeping up with regulations, seasonal weather conditions , staffing certification and costs. Risk Assessment and Implementation Issues • Integrated Pest Management Plans & Qualified certified applicators & regulation has potential to drive up prices for this service – Mitigated by establishing partnerships created with suppliers and state staff. • Long run ROI: Currently multiple Pest Control Entity contracts in place - Mitigated by demonstrating value which will result in admin fee increase as more entities begin to use this convenience contract • Culture Change: Changing state buyers perspective from traditional reactive approach to IPM approach of partnership with suppliers to erradicate pests • Implementation Issues: Coordination of Access and 24 hour support parameters. – Mitigated by Stakeholder input to facilitate requirements.
Created 03/11/2010 Definitions • Degree of Fragmentation – Of the identified entities, is the good/service/opportunity that is being considered easy or difficult to discern as related to the strategy; is the opportunity centralized/consolidated or fragmented within each organization or business unit (e.g. DHR – 6 business units within a division). This is a level of complexity question. • Business Criticality – How critical is this initiative, does it have a big/small impact; who’s really got the biggest need, what is the sense of urgency, what are the contingencies/impact if this doesn’t get put in place? • Spend – Where is this buried, who else have you considered outside of PS, Spend Cube, and etc., why/why not? What is the market telling you for “like-sized” organizations in both private/public sector. • Risk vs. Reward – Is your initiative risky to both SPD and the end customer(s)? After assessing the gaps (participating agencies and etc.)/issues/market intel.; does this have a high/low probability of success as related to efforts required vs. the outcome? • Unique vs. Standard – Looking at your strategy, does this initiative come with “unique” criteria that requires a specific discipline or area of concentration? If so, the level of complexity should correlate to a higher degree of risk and implementation (Hospital Privatization effort vs. toothpaste?). • NIGP Codes – What are the primary and identified NIGP codes for this category/commodity at the 5 digit level. SPD-PS003