Download

1 / 92
990 likes | 1.51k Views
ECG Rhythm Interpretation. Rubina Barolia Salima Moez ECG Interpretation. Course Objectives. To recognize the normal rhythm of the heart - “Normal Sinus Rhythm.” To recognize the most common life threatening arrhythmias. To recognize an acute myocardial infarction on a 12-lead ECG.

E N D
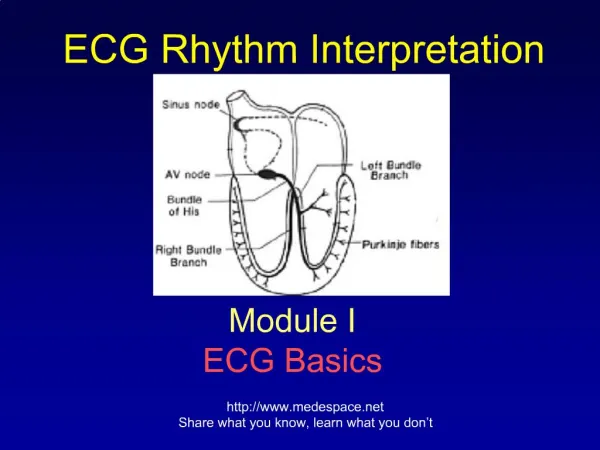
ECG Rhythm Interpretation Rubina Barolia Salima Moez ECG Interpretation
Course Objectives • To recognize the normal rhythm of the heart - “Normal Sinus Rhythm.” • To recognize the most common life threatening arrhythmias. • To recognize an acute myocardial infarction on a 12-lead ECG.
Introduction • Powered by an electrical impulse • Average heart beats 100,000 times a day • Pumping some 2,000 gallons of blood • Over a 70-year life span, that adds up to more than 2.5 billion heartbeats • Abnormally fast or unusually slow heart rates called arrhythmia
The ECG Paper • Horizontally • One small box - 0.04 s • One large box - 0.20 s • Vertically • One large box - 0.5 mV
The ECG Paper (cont) 3 sec 3 sec Every 3 seconds (15 large boxes) is marked by a vertical line. This helps when calculating the heart rate. NOTE: the following strips are not marked but all are 6 seconds long.
Rhythm Analysis Step 1: Calculate rate. Step 2: Determine regularity. Step 3: Assess the P waves. Step 4: Determine PR interval. Step 5: Determine QRS duration.
Step 1: Calculate Rate 3 sec 3 sec • Option 1 • Count the # of R waves in a 6 second rhythm strip, then multiply by 10. • Reminder: all rhythm strips in the Modules are 6 seconds in length. • Interpretation? 9 x 10 = 90 bpm
Step 1: Calculate Rate R wave • Option 2 • Find a R wave that lands on a bold line. • Count the # of large boxes to the next R wave. If the second R wave is 1 large box away the rate is 300, 2 boxes - 150, 3 boxes - 100, 4 boxes - 75, etc. (cont)
Step 2: Determine regularity R R Look at the R-R distances (using a caliper or markings on a pen or paper). Regular (are they equidistant apart)? Occasionally irregular? Regularly irregular? Irregularly irregular? Interpretation?Regular
Step 3: Assess the P waves Are there P waves? Do the P waves all look alike? Do the P waves occur at a regular rate? Is there one P wave before each QRS? Interpretation?Normal P waves with 1 P wave for every QRS
Step 4: Determine PR interval • Normal: 0.12 - 0.20 seconds. • (3 - 5 boxes) • Interpretation?0.12 seconds
Step 5: QRS duration • Normal: 0.04 - 0.12 seconds. • (1 - 3 boxes) • Interpretation? 0.08 seconds
Rhythm Summary Rate 90-95 bpm Regularity regular P waves normal PR interval 0.12 s QRS duration 0.08 s Interpretation? Normal Sinus Rhythm
Normal Sinus Rhythm (NSR) Etiology: the electrical impulse is formed in the SA node and conducted normally. This is the normal rhythm of the heart; other rhythms that do not conduct via the typical pathway are called arrhythmias.
NSR Parameters Rate 60 - 100 bpm Regularity regular P waves normal PR interval 0.12 - 0.20 s QRS duration 0.04 - 0.12 s Any deviation from above is sinus tachycardia, sinus bradycardia or an arrhythmia
Arrhythmia Formation Arrhythmias can arise from problems in the: • Sinus node • Atrial cells • AV junction • Ventricular cells
Rhythm #1 30 bpm Regular Normal 0.12 s 0.10 s Sinus Bradycardia • Rate? • Regularity? • P waves? • PR interval? • QRS duration? • Interpretation?
Sinus Bradycardia Etiology: SA node is depolarizing slower than normal, impulse is conducted normally (i.e. normal PR and QRS interval).
Rhythm #2 130bpm Regular Normal 0.16 s 0.08 s Sinus tachycardia • Rate? • Regularity? • P Waves? • PR Interval? • QRS Duration? • Interpretation?
Sinus Tachycardia Etiology: SA node is depolarizing faster than normal, impulse is conducted normally. Remember: sinus tachycardia is a response to physical or psychological stress, not a primary arrhythmia.
Premature Beats • Premature Atrial Contractions(PACs) • Premature Ventricular Contractions(PVCs)
Rhythm #3 70 bpm Occasionally irregular 2/7 diff contour 0.14 s (except 2/7) 0.08 s NSR with Premature Atrial Contractions • Rate? • Regularity? • P Waves? • PR Interval? • QRS Duration? • Interpretation?
Premature Atrial Contractions • Deviation from NSR • These ectopic beats originate in the atria (but not in the SA node), therefore the contour of the P wave, the PR interval, and the timing are different than a normally generated pulse from the SA node.
Premature Atrial Contractions • Etiology: Excitation of an atrial cell forms an impulse that is then conducted normally through the AV node and ventricles.
Rhythm #4 70 bpm Occasionally irregular None for 7th QRS 0.14 s 0.08 s (7th wide) Sinus rhythm with 1 PVC • Rate? • Regularity? • P Waves? • PR Interval? • QRS Duration? • Interpretation?
PVCs • Deviation from NSR • Ectopic beats originate in the ventricles resulting in wide and bizarre QRS complexes. • When there are more than 1 premature beats and look alike, they are called “uniform”. When they look different, they are called “multiform”.
PVCs Etiology: One or more ventricular cells are depolarizing and the impulses are abnormally conducting through the ventricles.
Supraventricular Arrhythmias • Atrial Fibrillation • Atrial Flutter • Paroxysmal Supraventricular Tachycardia
Rhythm #5 100bpm Irregular None None 0.06 Atrial Fibrillation • Rate? • Regularity? • P Waves? • PR Interval? • QRS Duration? • Interpretation?
Atrial Fibrillation Etiology: Recent theories suggest that it is due to multiple re-entrant wavelets conducted between the R & L atria. Either way, impulses are formed in a totally unpredictable fashion. The AV node allows some of the impulses to pass through at variable intervals (so rhythm is irregularly irregular).
Rhythm #6 70 bpm Regular Flutter waves None 0.06 s Atrial Flutter • Rate? • Regularity? • P Waves? • PR Interval? • QRS Duration? • Interpretation?
Atrial Flutter Etiology: Reentrant pathway in the right atrium with every 2nd, 3rd or 4th impulse generating a QRS (others are blocked in the AV node as the node repolarizes).
Rhythm #7 74 148 Regular regular Normal none 0.16 s none 0.08 sec Paroxysmal Supraventricular Tachycardia (PSVT) • Rate? • Regularity? • P Waves? • PR Interval? • QRS Duration? • Interpretation
PSVT • Deviation from NSR • The heart rate suddenly speeds up, often triggered by a PAC (not seen here) and the P waves are lost.
PSVT Etiology: There are several types of PSVT but all originate above the ventricles (therefore the QRS is narrow). Most common: abnormal conduction in the AV node (reentrant circuit looping in the AV node).
Ventricular Arrhythmias • Ventricular Tachycardia • Ventricular Fibrillation
Rhythm #8 160 bpm Regular None None Wide (>0.12 s) Ventricular Tachycardia • Rate? • Regularity? • P Waves? • PR Interval? • QRS Duration? • Interpretation
Ventricular Tachycardia Etiology: There is a re-entrant pathway looping in a ventricle (most common cause). Ventricular tachycardia can sometimes generate enough cardiac output to produce a pulse; at other times no pulse can be felt.