Growth of Check Image Exchange and Electronic Returns in the Financial Industry
This report on Check Image Collaboration details the transactions settled via Federal Reserve and other exchanges, highlighting significant advances from January 2011. It notes the almost complete implementation of check image exchange, with daily unpaid image returns reaching over 236,000 items by May 2011, totaling nearly $64 billion. Furthermore, it indicates the remarkable decrease in substitute checks since October 2007 and the growth of check image volumes over recent years. The report underscores electronic delivery's impact on transaction efficiency in the banking sector.

Growth of Check Image Exchange and Electronic Returns in the Financial Industry
E N D
Presentation Transcript
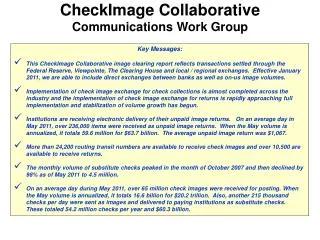
CheckImage Collaborative Communications Work Group • Key Messages: • This CheckImage Collaborative image clearing report reflects transactions settled through the Federal Reserve, Viewpointe, The Clearing House and local / regional exchanges. Effective January 2011, we are able to include direct exchanges between banks as well as on-us image volumes. • Implementation of check image exchange for check collections is almost completed across the industry and the implementation of check image exchange for returns is rapidly approaching full implementation and stabilization of volume growth has begun. • Institutions are receiving electronic delivery of their unpaid image returns. On an average day in May 2011, over 236,000 items were received as unpaid image returns. When the May volume is annualized, it totals 59.6 million for $63.7 billion. The average unpaid image return was $1,067. • More than 24,200 routing transit numbers are available to receive check images and over 10,500 are available to receive returns. • The monthly volume of substitute checks peaked in the month of October 2007 and then declined by 98% as of May 2011 to 4.5 million. • On an average day during May 2011, over 65 million check images were received for posting. When the May volume is annualized, it totals 16.6 billion for $20.2 trillion. Also, another 215 thousand checks per day were sent as images and delivered to paying institutions as substitute checks. These totaled 54.2 million checks per year and $60.3 billion.
Highlights: Chart reflects volume received by DFIs for payment. Average daily image volume grew from 52.68 to 65.04 million from June 2009 to May 2011. May 2011 volume annualized is 16.3 billion images received per year. Average # of Images Received /Day # Items in Millions Data Sources: Transactions settled through the Federal Reserve, Viewpointe, The Clearing House, selected ECCHO Full and Participating Members and other local / regional exchanges Apr-10 Jun-09 Oct-09 Dec-09 Jun-10 Dec-10 Oct-10 Feb-11 Feb-10 May-11 Aug-09 Aug-10
Highlights: Chart reflects the number of R/Ts available to receive images from other DFIs or an intermediary. Number of image-available receiving R/Ts grew from 19,170 to 24,223 from June 2009 to May 2011. R/Ts Available to Receive Images # of Image-Available R/Ts Data Sources: Transactions settled through the Federal Reserve, Viewpointe, The Clearing House, selected ECCHO Full and Participating Members and other local / regional exchanges Apr-10 Jun-09 Jun-10 Oct-09 Aug-09 Oct-10 May-11 Dec-09 Feb-11 Dec-10 Aug-10 Feb-10
Highlights: Chart reflects checks received by DFIs for payment. The monthly dollar amount received grew from $1.57 to $1.69 trillion. Annualized May 2011 dollar amount = $ 20.2 trillion/yr. $ Amounts of Images & Substitute Checks Forward Collection Only $ Amounts in Billions Data Sources: Transactions settled through the Federal Reserve, Viewpointe, The Clearing House, selected ECCHO Full and Participating Members and other local / regional exchanges Apr-10 Jun-09 Jun-10 Oct-09 Aug-09 Oct-10 May-11 Dec-09 Feb-11 Dec-10 Aug-10 Feb-10
Highlights: Chart reflects volume received by DFIs for payment. Substitute Check volume has decreased to the volume of March ’05. # of Images & Substitute Checks Forward Collection Only # Items in Millions Images Data Sources: Transactions settled through the Federal Reserve, Viewpointe, The Clearing House, selected ECCHO Full and Participating Members and other local / regional exchanges Substitute Checks Apr-10 Jun-09 Jun-10 Oct-09 Aug-09 Oct-10 May-11 Dec-09 Feb-11 Dec-10 Aug-10 Feb-10
Number of R/Ts Highlights: Chart reflects the number of R/Ts available to receive unpaid image returns from other DFIs or an intermediary. From June 2009 to May 2011, the number of R/Ts available to receive unpaid image returns has tripled from 3,511 to 10,546 R/Ts. (Data sources were modified for August 2010 forward) Available to Receive Image Returns # of R/Ts Available to Receive Returns Data Sources: Transactions settled through the Federal Reserve, Viewpointe, The Clearing House, selected ECCHO Full and Participating Members and other local / regional exchanges Apr-10 Jun-09 Jun-10 Oct-09 Aug-09 Oct-10 May-11 Dec-09 Feb-11 Dec-10 Aug-10 Feb-10
Highlights: This chart reports the volume trend of unpaid image returns delivered electronically to the receipt location designated by the bank of first deposit. Between June 2009 to May 2011, the volume of image returns has increased by 88% from an average daily volume of 125,000 to 236,000 (21 days in May). Average # of Image Returns/Day # Items in Thousands Data Sources: Transactions settled through the Federal Reserve, Viewpointe, The Clearing House, selected ECCHO Full and Participating Members and other local / regional exchanges Apr-10 Jun-09 Jun-10 Oct-09 Aug-09 Oct-10 May-11 Dec-09 Feb-11 Dec-10 Aug-10 Feb-10
Highlights: This chart reports the dollar amount trend of unpaid image returns delivered electronically to the receipt location designated by the bank of first deposit. Between June 2009 and May 2011, the monthly dollar amount of image returns has almost doubled from $2.7 to $5.3 billion. The average dollar amount of image returns ranged from a low of $1,067 per return to a high of $1,215. $ Amount of Returns $ Amounts in Millions Data Sources: Transactions settled through the Federal Reserve, Viewpointe, The Clearing House, selected ECCHO Full and Participating Members and other local / regional exchanges Apr-10 Jun-09 Jun-10 Oct-09 Aug-09 Oct-10 May-11 Dec-09 Feb-11 Dec-10 Aug-10 Feb-10
Highlights: Chart reflects volume received by DFIs for payment. Average daily image volume grew from .08 to 59.65 million from Qtr 1 2005 to Qtr 1 2011. Qtr 1 2011 volume annualized is 14.7 billion images received per year. Average # of Images Received /Day # Items in Millions Data Sources: Transactions settled through the Federal Reserve, Viewpointe, The Clearing House, selected ECCHO Full and Participating Members and other local / regional exchanges
Highlights: Chart reflects check images received by DFIs for payment. The quarterly dollar amount of images received grew from $1.7 billion to $4.6 trillion. Annualized Quarter 1 2011 dollar amount = $18.5 trillion/yr. $ Amounts of Images Received by Paying Institution $ Amounts in Billions Data Sources: Transactions settled through the Federal Reserve, Viewpointe, The Clearing House, selected ECCHO Full and Participating Members and other local / regional exchanges