Download
1 / 21
210 likes | 463 Views
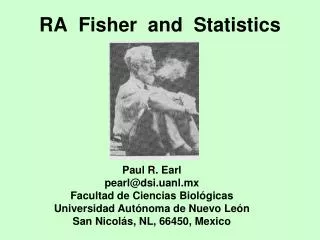
RA Fisher and Statistics. Paul R. Earl pearl@dsi.uanl.mx Facultad de Ciencias Biológicas Universidad Autónoma de Nuevo León San Nicolás, NL, 66450, Mexico.

E N D
RA Fisher and Statistics Paul R. Earl pearl@dsi.uanl.mx Facultad de Ciencias Biológicas Universidad Autónoma de Nuevo León San Nicolás, NL, 66450, Mexico
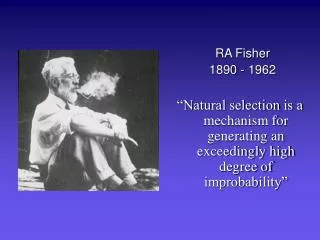
A view of the famous biometricianSir Ronald Aylmer Fisher (1890-1962) is the architect of multivariate analysis. BIOMETRICS of June 1964, Vol 20, No 2 is dedicated to him. Several books are now strongly recommended: An Introduction to Probability: Theory and its Applicaions by William Feller, Time Series Analysis, Forecasting and Control by George EP Box and Gwilym M Jenkins. See JP Benzecri (1982) Bordas, Paris. This much information is enough for a start. Be certain to read R. A. Fisher: The Life of a Scientist. Wiley, New York by Joan Fisher Box, 1978. Another enjoyable book is Choice and Chance by WA Whitworth, 1901 reprinted in 1942 by GE Stechert, New York.
Regardless, statistics poses a severe problem for many Latin students. The fault can be poor or little teaching of arithmetic and algebra. Students that fear mathematics cannot succeed in probability, statistics and so forth. On the other hand, students in engineering likely do very well with internet and math. Those students want to learn ! Regardless, the original public school problem seems to be slow reading.The first problem is data management. The students may not know how to enter variables X1, X2, X3... They might use 10 columns (cols) for sex which is 1 male, 2 female using up ONLY one col. Suppose X5 in letters takes 10-25 cols. Assign a number. Then this variable will need only 1-3 cols. This seems all very simple--but it's not !
Biostatistics lecture referencesSee http://www.pitt.edu/~super1/lecture/lec25191/001.htm on analysis of variance. See http://statgen.iop.kcl.ac.uk/bgim/mle/sslike_1.html on maximum likelihood,
Analysis of variance (Fisher's ANOVA)Three conceptual models of ANOVA are 1) Fixed-effects model, 2) Random-effects model and 3) Mixed effects, depending most on the number of treatments and levels of the experiment. Oneway gives differences among independent sets. Factorial can help to explain the effects of 2 or more treatment variables. often using 2 X 2 design. Multivariate analysis (MANOVA) is used with more than one dependent variables.
The total sum of squares is partioned into components related into the effects of the model. The number of degrees of freedom (df) can also be partioned and specifies the chi-squared distribution which describes the associated sum of squares.Source Sum of df Mean F squares Squares-----------------------------------------------------------------------------Factor A SSA a-1 MSA MSA/MSEFactor B SSB b-1 MSB MSB/MSEError SSE a*b(r-1) MSE------------------------------------------------------------------------------Total SST a*b*(r-1) r = repetitions Is the F ratio an error term ? Let's add probability = p. What does p = 0.01 mean ? The idea here is merely to give you a start. Simplicity is a great blessing ! What do you know about quality control, loss functions and experimentation ?
Maximum likelihood estimation (MLE)MLE is a method of fitting statistical models to observed data. Assuming that each observation is statistically independent, the joint probability of the observed data is given by the product of the individual probabilities:When considered as a function of the model parameter(s), this is called the likelihood function of the observed data. The MLEs of the model parameter(s) maximize the likelihood function or, equivalently, maximize the log-likelihood functionand can be calculated by any suitable method.
PAMLPAML is a package of programs for phylogenetic analyses of DNA or protein sequences using MLE. It is maintained and distributed for academic use free of charge by Ziheng Yang. ANSI C source codes are distributed for UNIX/Linux/MAC OS X and executables are provided for MS Windows. PAML may be useful if you are interested in the process of sequence evolution.
Some other biostatisticsThere are 2 kinds of statistical error depending on which hypothesis has been identified as the true state of nature.A null hypothesis is a speculation to be nullified or supported. An alternate hypothesis may prevail. The null hypothesis is presumed true until tested to be otherwise. A null hypothesis is a speculation to be nullified or supported. An alternate hypothesis may prevail. The null hypothesis is presumed true until tested to be otherwise.
A chi-squared test is any hypothesis test where the test statistic has a chi-squared distribution when the null hypothesis is true, or any in which the probability distribution of the test statistic (assuming the null hypothesis is true) can be made to approximate a chi-squared distribution as closely as desired by MAKING THE SAMPLE SIZE LARGE ENOUGH. Important ! ! Another popular small-sample test is Student's T-test.
Type I error or error of the first kind or alpha error ( error) is a false positive. The null hypothesis was rejected when it was actually true. Type II error or error of the second kind or beta error ( error) is a false negative. The error was not rejecting the null hypothesis when the alternate hypothesis is true.Actual condition True False Test result Positive True Positive (i.e. correct result) False Positive (Type I) (i.e. wrong result) Negative False Negative (Type II) (i.e. wrong result) True Negative (i.e. correct result)Type I is usually set at 0.05 or 0.01. Refer to the F ratio in ANOVA.
Fisher informationThe Fisher information is the variance of the score. It is the amount of information that a random variable X carries above an unobservable variable (parameter) on which the likelihood function of X, L () = F (X, ) depends. The likelihood function is the joint probability of the data. As the expectation of the score is zero, the variance is the second moment of the score, the derivative of the log of the likelihood function with respect to .
The following modified biography of Fisher mostly by PC Mahalanobis appeared in Sankhy, 4, 1958.Fisher was born on the 17th of February in 1890 in East Finchley, one of the northern suburbs of London. Love of mathematics dominated his education. Harrow was a model school available to Fisher since his family was rich. The only difficulty was very bad eyesight. This kept him out of World War I.He entered Gonville and Caius College, Cambridge in 1909, and passed the Mathematical Tripos Part II in 1912 as a Wrangler. Under the negative influence of Bateson against Darwinism, Fisher became keenly interested in Mendelism. He thus wrote The General Theory of Natural Selection by 1930 containing the survival of Darwinism..
FundamentalsExact measurements compactly tabled should make up the the experiment. Replication, randomization and block division are fundamental statistical elements. Accuracy is the deviation between the experimental and true results. Precision is related to the spread of the sample. This dispertion is given by the standard deviation. Replication is essential because it is the sole source of the estimate of error, while randomization is necessary to guarantee the validity of the estimate, i. e., to ensure that the estimate will be unbiased.
The general theory of natural selectionFisher had been working for a long time on Mendelism and genetics. His book on Genetical Theory of Natural Selectionwas published in 1930 and constituted a milestone. The 3 men that founded the theory of population genetics and thereby NeoDarwinism were Sewall Wright, JBS Haldane and RA Fisher.
More biographyHe was appointed Galton professor in the University of London on the retirement of Karl Pearson in 1933. Fisher was always interested in eugenics--human genetics--associated with the Eugenics Society first as Honorary Secretary and later as Vice-President. He also took over from Karl Pearson the editorial charge of the Annals of Eugenics in 1933.In 1935, Fisher published Design of Experiments. He visited the USA in 1936 and received an honorary degree from Harvard. In 1937, he accepted a fellowship from the Indian Statistical Institute.
The main currents of Fisher's work are shown next.Fisher's work falls naturally into 3 main streams:-Contributions to the mathematical theory of statistics-Application of statistical theory to agriculture and the design of experiments-Contributions to genetics.
The theory of sampling distributionThe idea of the random sampling distribution of statistics is fundamenal. Introduce the algebra of point sets. The probabilityof the entire sample space is unity, or P = 1. The earliest example of the modern type of distribution was that of 2 (Chi squared) by Karl Pearson in 1900. Several years later Student gave the correct distribution of the sample variance and his now famous T-statistic. Student was the pename of William S Gossett..
The theory of estimates and statistical inferenceFierce controvercy has raged over this subject since 1768 of Bayes' An Essey towards Solving a Problem in the Doctrine of Chance (Phil Trans liii, p 370) in which he proposed to solve this problem with the help of the principle of equal distribution of ignorance. Fisher enlightened the probllem in his notable memoir On the Mathematical Foundation of Theoretical Statistics (1921). This work laid the foundations of statistical inference by emphasizing the importance of exact solutions of sampling problems.
Human blood groups by RR Race of the Lister Institute, London in BiometricsOne outcome of Fisher's long interest in human genetics was his setting up in 1935 a blood grouping department in the Galton Laboratory. This was made possible by a grant from the Rockefeller Foundation and by the willingness of the late Dr GL Taylor, an expert serologist, to leave the Department of Pathology at Cambridge and devote himself to blood groups, reviewed by RR Race in the 1964 memoirial issue of Biometry.
Fisher saw in the blood groups a hopeful tool for the improvement of knowledge of human genetics. WL Stevens and DJ Finney were then at the Galton Lab. Stevens applied Fisher's method of maximum liklihood to calculations of the A1A2BO and MN frequencies (Edwards AWF (1972) Likelihood. Cambridge University Press and Sham PC (1998) Statistics in Human Genetics. Arnold, London ). Finney extended and applied Fisher's u-statistics to linkage tests involving blood groups.