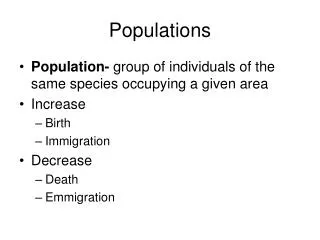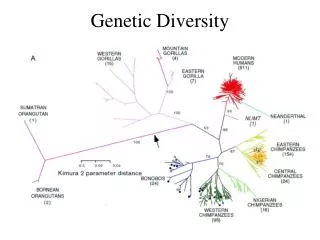
Genetic diversity among populations (and factors that increase or decrease diversity)
Genetic diversity among populations (and factors that increase or decrease diversity). Populations that are spatially isolated will tend to diverge genetically genetic drift natural selection and local adaptation. p = .8 q = .2. p = .5 q = .5. p = .7 q = .3. p = .55 q = .45. p = .5

Genetic diversity among populations (and factors that increase or decrease diversity)
E N D
Presentation Transcript
Genetic diversity among populations (and factors that increase or decrease diversity)
Populations that are spatially isolated will tend to diverge genetically • genetic drift • natural selection and local adaptation p = .8 q = .2 p = .5 q = .5 p = .7 q = .3 p = .55 q = .45 p = .5 q = .5
Genetic diversity among populations • Increases due to isolation, followed by • genetic drift • inbreeding • selection • local adaptation • Decreases due to gene flow (migration) as migrants move between populations, they homogenize allele frequencies among populations • larger populations diverge slowly through drift – few migrants needed to counteract • small populations diverge rapidly through drift – more migrants needed to counteract
Changes in genetic diversity among populations m = proportion of population that migrates Nm = number of migrants randomly exchanged per generation Ne = 1,000, m = 0.01, Nm = 10 Ne = 100, m = 0.01, Nm = 1 approx 1 migrant/generation will maintain same alleles among populations (= qualitative similarity) but 10 migrants per generation may still permit significant differences in allelic frequencies ( = quantitative dissimilarity)
Changes in genetic diversity among populations m = proportion of population that migrates Nm = number of migrants randomly exchanged per generation Ne = 1,000, m = 0.01, Nm = 10 Ne = 100, m = 0.01, Nm = 1 “in the absence of natural selection, the amount of genetic divergence among demes is a function of the absolute number of migrants exchanged (Nm), not the proportion of exchange (m)” (Allendorf 1983)
Isolation by distance p = 0.65 q = 0.35 p = 0.75 q = 0.25 p = 0.55 q = 0.45 p=0.5 q=0.5 p = 0.5 q = 0.5 p = 0.4 q = 0.6
Isolation by distance http://www.youtube.com/watch?v=31qBrRawDK8
Isolation by distance Mussel ‘lures’ with glochidia
Genetic distance between populations Elliptio dilatata
Clegg, S.M., S.M. Degnan, J. Kikkawa, et al. 2002. Genetic consequences of sequential founder events by an island-colonizing bird. PNAS 99:8127-8132 silvereye (Zosterops lateralis)
Issues with genetic diversity among populations outbreeding depression/hybridization • local adaptation
Issues with genetic diversity among populations outbreeding depression/hybridization • local adaptation example: ibex extirpated from Czechoslovakia (Capra ibex ibex) - transplanted from Austria successfully (Capra ibex ibex) - then added bezoars (C. i. aegagrus) and Nubian ibex (C. i. nubiana) - fertile hybrids rutted in early fall instead of winter (as natives did) - kids of hybrids born in February, coldest month of year, entire population went extinct David Hall
Issues with genetic diversity among populations outbreeding depression/hybridization • local adaptation • co-adapted gene complexes
Loss of fitness due to - Inbreeding: accumulation of homozygous recessives loss of superior heterozygotes Outbreeding: reduced fitness of F1 generation - disruption of local adaptation - epistatic interactions reduced fitness of F2 generation - breakup of co-adapted gene complexes More empirical studies on inbreeding than outbreeding….
inbreeding depression outbreeding depression Reproductive success inbreeding random mating inter-breeding
Why do we care? Inbreeding: may be last recourse for endangered population Outbreeding: dangerous consequence of saving small popns. “Genetic pollution” controversy
Florida panther: declined due to habitat loss, poaching, road kills evidence of inbreeding: low fertility, sperm abnormalities, cowlicks, kinked tails, cardiac defects, undescended testicles, high disease rate
Florida panther: Genetic studies indicated low variability: P H DNA H Florida 4.9 1.8 10.4 Western US 9.9 4.3 29.7 Other felids 8-21 3-8 45.9 Found to have hybridized with S. American sub- species; introgressed animals with higher P
Florida panther: Outbred with sub-species from Texas - added 8 females in 1995 F1 hybrid kittens do not have cowlinks or kinked tails Texas genes are now 15-29% of total
Cheetah (Acinonyx jubatus): O’Brien et al. 1983. The cheetah is depauperate in genetic variation - using protein electrophoresis # # % poly. av. Species popns. N loci loci H Drosophila 43 >100 24 43.1 0.14 Mus 2 87 46 20.5 0.088 Homo sapiens many >100 104 31.7 0.063 Felis catus 1 56 55 22 0.076 Cheetah 2 55 47 0.0 0.0
Cheetah (Acinonyx jubatus): Menotti-Raymond and O’Brien et al. 1993. - using protein electrophoresis, high-resolution PE, and mtDNA # # % poly. av. Species popns. N loci loci H Drosophila 43 >100 24 43.1 0.14 Mus 2 87 46 20.5 0.088 Homo sapiens many >100 104 31.7 0.063 Felis catus 1 56 55 22 0.076 Cheetah 2 55 47 0.0 0.0 Drosophila 1 20 54 11.1 0.04 Mus 1 72 4.1 0.02 Homo sapiens 1 34 many 1.2 0.063 Cheetah 1 6 155 3.2 0.013 Felis catus 1 17 46.0 Cheetah 3 76 45.0
O’Brien et al. 1983. The cheetah is depauperate in genetic variation - assumed to be result of small N, bottleneck, then inbreeding - highly vulnerable to disease outbreaks (50% mortality in one captive population)
O’Brien et al. 1983. The cheetah is depauperate in genetic variation - assumed to be result of small N, bottleneck, then inbreeding - highly vulnerable to disease outbreaks (50% mortality in one captive population) Merola, 1994. A reassessment of homozygosity …. - carnivores tend to show low levels of genetic variation (several have lower levels of H and P than cheetah) - measures of fluctuating asymmetry indicate cheetah is not suffering from low homozygosity or genetic stress - sperm deformities – do not affect fertility, may be normal in felids - low litter sizes – in captivity (high in wild) - susceptibility to disease – may be due to captive contact (in wild, cheetahs avoid conspecifics) Concluded that conservation is better directed at habitat