Download
1 / 24
240 likes | 257 Views
This research paper explores the effects of floods on sandbars in the Grand Canyon, as well as their impact on trout and chub populations. The study examines the changes in sandbar size and the export of sand due to floods. It also discusses the ongoing monitoring efforts and uncertainties surrounding the rebuilding and maintenance of sandbars.

E N D
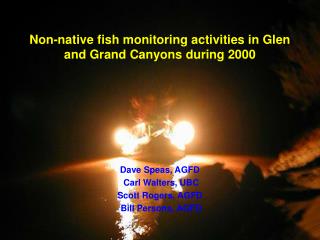
Sandbars and Floods in Grand Canyon: Current Research and Monitoring Paul Grams, USGS
Overview What have we learned? When will we have another flood? How will we know if floods are working to rebuild sandbars? What do floods have to do with trout and chub?
What do Floods do? • Floods do build sandbars and there has been some net gain since before the first flood in 1996. • Floods do cause net export of sand (more sand goes downstream than goes up on the banks). • Sandbars erode following floods. • Spring floods benefit rainbow trout populations as a result of improvements in spawning and rearing habitat (uncertainty exists for floods at other times) • Floods have had no measurable positive impacts on humpback chub populations (High Flow Circular, chapters 3 and 4)
Floods build sandbars (in lots of places)
Floods build sandbars Pre-2008 HFE – RM 6 Post-2008 HFE – RM 6 (not everywhere)
Changes in Sandbar Size in Marble Canyon and Eastern Grand Canyon, 1996-2009 10/20 bars are the same or larger in size than the 1996 pre-HFE condition Adapted from Hazel and others, 2010
Changes in Sandbar Size in Central and Western Grand Canyon, 1996-2009 20/20 bars are the same or larger in size than the 1996 pre-HFE condition Adapted from Hazel and others, 2010
Floods do export sand • If conducted following periods of sand input from the tributaries, they don’t have to export more than was accumulated Adapted from Topping and others, 2010
Where is the sand? ~50 to 90% of the sand in Marble Canyon is stored in eddies. About 90% of the sand in eddies is stored below the stage elevation reached by a flow of 8,000 ft3/s (Hazel et al., 2006, J. Geophys. Res., 11).
Deposition dominates above 8,000 cfs level, often at expense of erosion below loss gain loss gain Demonstrates the difference between high- and low-elevation response “Response above 8,000 cfs” “Response below 8,000 cfs” Hazel and others (2010)
Conceptual model for interpretation of repeat channel mapping information loss gain loss gain Long-term monitoring designed to evaluate whether dam operations (including floods) result in declines in sand storage in the channel Mining sand from storage Probably good news! “Sandbars above 8,000 cfs” Accumulating sand, not building bars - Could be having more floods! Mining sand and losing sandbars “Channel and eddies below 8,000 cfs”
Long-term monitoring designed to evaluate whether dam operations (including floods) result in declines in sand storage in the channel 2011 channel mapping trip (launching next Saturday) is collecting these data between the LCR and Phantom Ranch
May 2009 near RM 36 • There is a lot of sand on the bed in some locations • Is the amount increasing or decreasing? • See Kaplinski talk this afternoon!
Most Significant Biological Response: More Trout From Korman and Melis (2011) Discussed in High flow circular ch. 4
How do we determine when to have high flows? • Tracks tributary sediment inputs and mainstem transport at five locations to track status of the sediment “bank account.” • Provides the information needed to time high flows for building sandbars to follow periods of sand accumulation. USGS Sediment Flux Monitoring Program in Grand Canyon Shifting rating curve sand routing model 15
How do we determine when to have high flows? • Tracks tributary sediment inputs and mainstem transport at five locations to track status of the sediment “bank account.” • Provides the information needed to time high flows for building sandbars to follow periods of sand accumulation. USGS Sediment Flux Monitoring Program in Grand Canyon Shifting rating curve sand routing model 16
Sand budget from end of 2008 HFE to August 17, 2010 Preliminary results – subject to review and revision
Sand Input Triggering StrategySuggests that HFEs follow Historical Timing of Paria and Little Colorado River Floods (Fall & Spring) Little Colorado River Paria River From High Flow Circular Chapter 5, figure 5)
Fall & Spring Timing Associated with Suggested Triggering Strategy has Historical Precedent in Pattern of Natural Floods during Pre-Dam Record From High Flow Circular Chapter 5, figure 6)
FREQUENCY OF HFE TRIGGERING? • The 85-year record of Paria River flow suggests that about 2/3 of HFEs are likely to be triggered in the Fall season – following sand inputs that occur from July into October • In some years, but rarely, Paria River floods have occurred in winter, but LCR flooding is more common in that season • Perhaps 1/3 of the HFEs triggered would occur in spring in response to LCR and/or Paria River sand inputs that occur between December and March • In some years HFEs might be triggered in both spring and fall
UNCERTAINTIES STILL REMAIN • It is unknown whether the suggested triggering option for long-term experimentation can rebuild & maintain sandbars at desired levels (desired conditions remain unclear) • Factors influencing rainbow trout response in the Lees Ferry tailwater reach are still poorly understood – tests of alternative timing are needed • Consistent long-term monitoring is critical for reducing the above uncertainties about future HFEs • HFEs are the only known means for rebuilding eroded sandbars - without sand-enriched high flows, sandbar size will decrease through time
From Chapter 5, Wright and Kennedy, 2011 Pre-2008 HFE – RM 6 Result of Delayed HFE Release in March 2008 following large Fall sand inputs in 2006 & 07? ? Post-2008 HFE – RM 6
Monitoring for high flows What questions will we want to answer if there are repeated high flows over the next 10 years? • Will multiple high flows conducted over a period of several years result in net increases in sandbar area and volume? • Addressed by monitoring sandbars above 8,000 cfs stage. • Annual to every-other year monitoring of long-term sandbar monitoring sites. • Systemwide monitoring every 4 years by remote sensing overflights. • With the available sand supply (i.e. tributary inputs) is the approach of using repeated floods to build sandbars sustainable? • Addressed by repeat mapping of the channel bed by multibeam sonar (bathymetric remote sensing). • How will the aquatic food web and fish populations respond?
Acknowledgements David Topping, USGS Joe Hazel, NAU Matt Kaplinski, NAU Jack Schmidt, USU Scott Wright, USGS Ted Kennedy, USGS Barbara Ralston, USGS Lara Schmit, NAU Ted Melis, USGS Josh Korman, Ecometric