Download
1 / 21
210 likes | 401 Views
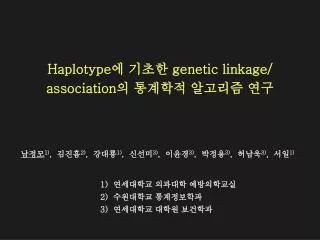
Haplotype 에 기초한 genetic linkage/ association 의 통계학적 알고리즘 연구. 남정모 1) , 김진흠 2) , 강대룡 1) , 신선미 3) , 이윤경 3) , 박정용 3) , 허남욱 3) , 서일 1). 1) 연세대학교 의과대학 예방의학교실 2) 수원대학교 통계정보학과 3) 연세대학교 대학원 보건학과. Background. Linkage Association

E N D
Haplotype에 기초한 genetic linkage/association의 통계학적 알고리즘 연구 남정모1), 김진흠2), 강대룡1), 신선미3), 이윤경3), 박정용3), 허남욱3), 서일1) 1) 연세대학교 의과대학 예방의학교실 2) 수원대학교 통계정보학과 3) 연세대학교 대학원 보건학과
Background LinkageAssociation Recombinant fraction Allelic disequilibrium Family Population - Trio (TDT) - Case-Control - (Affected) Sib-Pair Single locus Tightly linked multi-locus (Haplotype)
Background Why haplotype-based? But … • Haplotype set of closely linked genetic markers present on one chromosome which tends to be inherited together • Many markers are genotyped within a very short physical distance • More informative • Haplotype information is not usually available from genotype information (Haplotype reconstruction) eg. When # of heterozygous loci=c, # of possible haplotype pairs=2c-1
Background (Haplotype ambiguity) • Hypothetical family trio • Probable haplotype pairs • In Sample 1, F’s haplotype uncertainty exists ! • In Sample 2, haplotypes of parents are deducible !
Background Previous researches • Wilson (1997, AHG), Clayton & Jones (1999, AJHG) : Discard families with ambiguous haplotypes • Clayton (1999, AJHG) : likelihood-based but not robust to population admixture • Zhao et al. (2000, AJHG) : How to resolve haplotype ambiguity ? Allocate a conditional probability to each of haplotype group corresponding to a set of genotypes
Haplotype-based TDT (Zhao et al., 2000) • For each g, estimate the number of families : F with {Hi , Hj} transmits Hi and M with {Hk , Hl} transmits Hk • Transmission / Non-transmission table
Haplotype-based TDT (Zhao et al., 2000) • Based on Spielman & Ewens(1996)’s multi-allelic TDT • Remark • Ts&e follows the chi-square distribution with df = h-1 asymptotically ? No except h=2 • Why ? Sham(1997,AJHG) & Lazzeroni and Lange(1998, Hum Hered) + dependency between cell counts • ⇒ obtain empirical p-value by randomization process
Purpose • Propose new haplotype-based linkage / association test • Investigate empirical levels and powers of proposed test statistics by simulation • Test linkage / association between 4 SNPs (A-240T, T-93C, I/D, G2350A ) in ACE (Angiotensin-I Converting Enzyme) gene and hypertension
Proposed haplotype-based Score and LR test • Stuart (1955) • Bradley & Terry (1952)
Simulation studies (A1, A2, D, A3) # of loci = 3 A1 → a1 A2 → a2 A2 → a2 D→ d A3 → a3 A3 → a3 A3 → a3 A3 → a3 H1 H2 H3 H4 H5 H6 H7 H8 Fig.1 Genealogy of four mutations at four loci used in simulation study
Simulation studies • Types of haplotype frequencies • Haplotype with disease susceptible mutant allele = H7 ,H8 • Background risk of disease occurrence = 0.1, 0.2 • RR=1(level); 1.2, 1.6, 2.0, 4.0, 6.0(power) • # of subjects in each population = 200 • Generate genotype data for Case-Control(1 : 2) and Trio • # of replication = 200 ; # of resampling = 100
Kangwha study • 783 students who were aged of 15 at Kangwha in 1995 were monitored up to 1997 every year • Phenotype : High BP • Case : students experienced at least once SBP>130mmHg or DBP>85mmHg Control : selected from the student having the lowest BP sequentially Case : Control = 101 : 176 • Trio : students whose parents’ genotypes are available among students in Case group, 40 trios • 4 SNPs : A-240T, T-93C, I/D, G2350A of ACE in region 17q23
, Schematic diagram of the human ACE gene illustrating the location of 10 biallelic polymorphisms. Ploymorphisms are numbered in base pairs relative to the start of transcription of the ACE gene. Exons 1-26 are indicated with vertical bars and are numbered intermittently for clarity. Keavney et al., Human Molecular Genetics 1998
Estimated haplotype frequencies † Denote haplotypes corresponding to pair of (I/D, A-240T, T-93C, G2350A) ‡ EH, SAS, Proposed algorithm
P-value of association and linkage test † Normal approximation and Yate’s continuity correction ‡ Zhao et al. (2000, AJHG)’s and Score tests § Zhao, Curtis and Sham (2000, Hum Hered)’s χ2 test
Summary • Investigate single locus-based and haplotype-based association/ linkage test - single locus-based < haplotype-based - population-based <? > family-based • Hypertension is NOT linked with the markers on ACE gene , but… • In the future … - how to reduce the haplotype uncertainty - how to include observations with only one parent or with only sibship - how to combine all types of observations into one test statistic