Download
1 / 33
330 likes | 464 Views
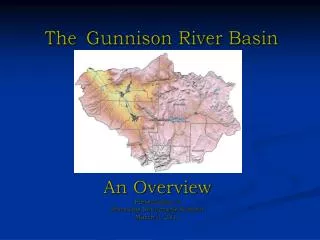
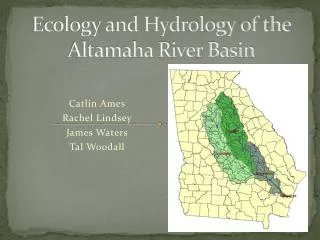
Ecology and Hydrology of the Altamaha River Basin. Catlin Ames Rachel Lindsey James Waters Tal Woodall. Problem Statement.

E N D
Ecology and Hydrology of the Altamaha River Basin Catlin Ames Rachel Lindsey James Waters Tal Woodall
Problem Statement • Currently GCSU does not have a compiled interactive database for study information in our own and surrounding Basins. Ecological and Hydrological data research and information is available but is not accessible due to lack of a database. • Access to information is one of the leading causes of misinformation, and ignorance. • Our goal is to create an interactive geodatabase for the Altamaha River Basin that can be continuously updated and viewed by anyone interested in the basin.
Problem Statement Breakdown • Austin- Display mammalian data of the basin on the database. • Catlin-Display fish species and diversity of the Altamaha River Basin. • Tal- Display the bird data of the Altamaha River Basin in the Geodatabase. • Rachel- Display the hydrologic data on record of the Altamaha River Basin.
Fish Species Diversity in the Ohoopee and Lower Oconee River Basins Using collection site data compiled from Dr. Christopher Skelton and Hank Forehand
Methodology • I took the collection site data and extracted the mean diversity value to spatially represent fish diversity by County, Physiographic, and HUC basins.
Procedure • To start I had to convert the collection points to raster. • To make diversity values into a raster • -conversion tools • -to raster • -point to raster
Procedure • I used Zonal Statistics under Spatial Analyst tools to make a new table containing the raster values extracted to the shapefile of choice (i.e. County). • I then joined the new table to the shapefile (i.e. County) and used categories to represent the mean diversity value by theme
Results Fish Species Diversity By Physiographic Region and HUC 6 • The Washington Slope physiographic region covering Baldwin, Hancock, and Jones Counties had the highest overall mean species diversity. • HUC 10 basin diversity shows that the Ohoopee Basin is higher in mean diversity.
Results Mean Diversity by HUC 12 basin • The individual basins show scattered diversity values. • More consistent values are seen in the Ohoopee River Basins • This spatial representation shows the lack of collection data for the area.
Discussion • Fish diversity understanding is important as stated by Stephen B. K. Sekiranda et al., ”High diversity indicates low environmental impacts in the habitats while low diversity is an indicator of high impacts of environmental degradation.” • The lack of correlation and contradiction between physiographic and HUC basins is most likely due to the lack of collection data from the area. • Land use examination would also help to understand the environmental impacts in the area, and also knowledge of invasive species (i.e. predatorial fish, river fauna) could contribute too.
Bat Study in Baldwin County By: Austin Waters Summary • Sixteen different bat species have been documented in Georgia. • Baldwin County is located on the boundary of two differing faunal provinces, • which would lead many to believe that Baldwin would have a great species diversity. • Before Dr. Parmley and Bender’s research only 1 species of bat had been documented • in Baldwin County, despite the fact that most of the surrounding counties had at • least 7 species Already on record. • Their research consisted of fifteen different sampling sites around Baldwin County. • These collection points are located in a variety of settings including; buildings, • woods, and over water. • The majority of the collection was done during the summer months. • The researchers data helped fill in many distribution gaps that were located in • Central Georgia. • Their research has proven to be very useful for determining which species of bat live • in Baldwin County. All of the data and information concerning bat species in Baldwin County used in this project was collected by Michael J. Bender and Dennis Parmley.
Documented Bat Species in Baldwin County Nycticeiushumeralis Lasiurus borealis Eptesicusfuscus Perimyotissubflavus Myotisaustroriparius Tadaridabrasiliensis Lasiurusseminolius
Bat Sampling Sites in Baldwin County 1998 Landcover image from www.narsal.uga.edu
Methodology • Species diversity varies from site to site. • Some insight into why each site’s diversity varies could be determined by the surrounding area’s (1000m) landcover. • After creating the buffers around each site in ArcMap I was able to use ERDAS IMAGINE 9.2 to determine the number of pixels of each type within each buffer zone. • Lastly, in Excel I was able to use pivot tables to create charts displaying the percentages of each type of landcover within the buffer zones. • Note: pixels equal 30x30 meter blocks
Legend Metadata GCSU Geographic Research Center Cartographer: Austin Waters Projection: NAD_1983_UTM_Zone_17N Datum: D_North_American_1983 Creation Date: 04/23/09
Discussion of Bat Study • When you begin to look at the diversity of bats at different points in Baldwin County and compare it to the landcover that surrounds the sites much can be learned. • With long term data collection you might be able to determine which species live in more urban landcover as opposed to rural. • Long term data collection would also provide insight into the roosting habits of different species during different seasons. • Dr. Parmley and Bender’s research told a lot about which species of bat live in Baldwin County, but more research is needed to determine why these species choose to live where they do. • However, you can already see how the more urban areas exhibit less diversity, while the site with the highest diversity has the highest amount of agriculture and mixed forest type landcover.
Altamaha River Basin Bird Species Distribution StudyBy: Tal Woodall Magnificent Frigate Bird Tricolored Heron Great Horned Owl Red Tailed Hawk American Oystercatcher
Altamaha River Basin Bird Species Data • Data compiled from, Christmas Bird Count Data, Breeding Bird Surveys, the Georgia Breeding Bird Atlas project, and banding records • Species data for each county entered into excel table and joined to the map of counties within the basin
Altamaha River Basin Bird Species Data • Table of population data for each county joined to species count map • Normalization tool used to obtain ratio of total species per county compared with the population data for that county
Altamaha River Basin Bird Species Data • Landcover raster image obtianed from X:DATA/Georgia intitled: 1998_30m_18class_12/17/01.img • Clipped the raster image down to the counties within the river basin • Classified the landcover of the area for analysis of why the amount of species occur where they do and what species may be found there
Altamaha River Basin Bird Species Data • Excel spreadsheet utilized to obtain total number of species counted for each county and total of a certain species within the basin
Altamaha River Basin Bird Species Study Discussion By looking at the distribution of the species counts for each county one may begin to see some patterns that relate to population, area and land cover. From the first map it is apparent that some of the larger counties have the highest species diversity. This may be due to the actual number of bird watchers in the county or a greater concentration of birds of various species. When comparing the maps some of the suspected patterns are validated and others falsified. For instance, the counties on the northern rim of the basin had some of the highest species diversity but when this data was compared to the county populations they had the lowest ratios. This is probably due to this area being heavily populated as part of Metro Atlanta and greatly outnumbering the species counts. Moving towards the coast and looking at the southern end of the basin, the distribution is much more diverse due to the area being much less populated but still having moderate species counts. The last map of the landcover of the basin can be used to create some inferences on what birds may be causing the variance in the species distribution and the species to population ratios.
Hydrology of the Altamaha River Basin • All data was gathered from www.usgs.gov • The information was gathered from individual gauge points within the Altamaha Basin. • There are two sets of data for each gauge site: • Low Flow Statistics • High Flow dates
Hydrology of the Altamaha River Basin • The low flow data is represented as “30Q2”; which means that every 30 years, the stream flows at the level listed for 2 years. • For example if Fishing Creek’s low flow was 30Q2: 1.2 cfs, then every 30 years fishing creek would have a base flow of only 1.2 cfs. • There were a total of 80 points within the Altamaha River Basin (including the Oconee, Ocmulgee and Little Ocmulgee basins) • Only about 60% of those sites have low flow data.
Hydrology of the Altamaha River Basin • The high flow data represents the highest level of water in each stream over an interval of 20+ years. Streams that did not have data for at least 20 years (1980-2000) were not included. • Only 40% of the gauge points had high flow data. Most sites had no more than 5 years of data available.
Hydrology of the Altamaha River Basin Why is it important? • Low flow data can be used in watershed management by allowing you to predict the course of that stream in the future. • You will know that the water will be so low in 30 years, so you can predict the effect it will have on your stream/community and prepare for it.
Hydrology of the Altamaha River Basin Why is it important? • High flow data can be used to predict stream flow patterns during specific precipitation events. • This allows you to be better prepared for storms and flood events.
Hydrology of the Altamaha River BasinMap of all gauge points within the Altamaha River Basin
High Flow by year 39% are from 1994 23% are from 1998 19.3% are from 1990
Discussion: • Overall there needs to be a better effort made to gather data for all of the gauge points. As it stands, there is very little long term data available. As previously stated, high and low flow data are valuable to watershed management in terms of predicting and preparing for future events whether those events are droughts or hurricanes.
References • Catlin Ames • Victoria, Uganda." GIS-spatial comparisons of fish community structure in three bays with varying catchments of land use, Lake Victoria, Uganda. Proc. of 2nd Eastern Africa ESRI User Conference (EAUC), Kampala, Uganda. 13 Sept. 2007. National Fisheries Resources Research Institute. 26 Apr. 2009 <http://www.firi.go.ug/Publications/FIRRI%20Papers/GIS_psartial_compariosn_of_fish.pdf>. • Rachel Lindsey • www.usgs.gov • Austin Waters • www.narsal.uga.edu • Bender, Michael J., and Dennis Parmley. "Noteworthy records of bats from Central Georgia." Southeastern Naturalist 7 (2008): 619-26.