Download
1 / 68
1.16k likes | 2.47k Views
Fundamentals of Measurement Theory. Measurement. Measurement is crucial to the progress of all sciences. Scientific progress is made through observations and generalizations based on data and measurements.

E N D
Measurement • Measurement is crucial to the progress of all sciences. • Scientific progress is made through observations and generalizations based on data and measurements. • The confirmation or refutation of theories via hypothesis testing depends on empirical data and measurement.
Example Hypothesis • “The more rigorously the front end of the software development process is executed, the better the quality at the back end.” • To confirm or refute this proposition we need to: • Define the key concepts, e.g., “the software development process”. • Distinguish the process steps and activities of the front end from those of the back end.
Sample Development Process(After Requirements Gathering) • Design • Design review and inspections • Code • Code inspections • Debug and development tests • Integration of components and modules to form the product • Formal machine testing • Early customer programs
Front-End and Back-End Steps • Assume everything through debugging and development tests is the front end. • The back-end is everything from integration onward.
Definition of Rigorous Implementation • “Total adherence to the process: Whatever is described in the process documentation that needs to be executed is executed.” • We need to specify the indicators of the definition and make them operational. E.g., if the process requires that all designs and code are inspected, an operational definition of rigorous implementation may be inspection coverage in terms of the percentage of actual lines of code actually inspected.
How Would We Operationally Define “Rigorous Testing”? • Possibly using measurement indicators such as: • The percent coverage in terms of instructions executed • The defect rate expressed in terms of the number of defects removed per thousand lines of source code
How Would We Operationally Define “Back-End Quality”? • Possibly in terms of “the number of defects found per KLOC during formal machine testing”
Possible Testable Hypotheses • For software projects, the higher the percentage of the designs and code that are inspected, the lower the defect rate at the later phase of formal machine testing. • The more effective the design reviews and the code inspections as scored by the inspection team, the lower the defect rate at the later phase of formal machine testing.
Possible Testable Hypotheses (Cont’d) • The more thorough the development testing (in terms of test coverage) before integration, the lower the defect rate at the formal machine testing phase.
What Are Additional Questions We Need to Ask? • Are the indicators valid? • Are the data reliable? • Are their other variables we need to control when we conduct the analysis for hypothesis testing?
Abstraction Hierarchy Theory Concept Proposition Definition Abstract World Empirical World Hypothesis Operational Definition Data Analysis Measurements in the Real World
Levels of Measurement • The four levels of measurement: • Nominal Scale • Ordinal Scale • Interval Scale • Ratio Scale • The scales are hierarchical. • One should always try to devise metrics that can take advantage of the highest level of measurement allowed by the nature of the concept and its definition.
Nominal Scale • Separating elements into categories with respect to a certain attribute • The categories must be jointly exhaustive • The categories must be mutually exclusive
Ordinal Scale • Refers to the measurement operations through which the subjects can be compared in order. • Not only can we group elements into categories, but we can order the categories. • The scale offers no information about the magnitude of the differences between the elements.
Interval Scale • Indicates the exact differences between the measurement points. • Requires a well-defined unit of measurement that can be agreed on as a common standard and that is repeatable.
Ratio Scale • When a absolute or nonarbitrary zero point can be located on an interval scale it becomes a ratio scale. • It is the highest level of measurement and all mathematical operations can be applied to it. • Almost all interval measurement scales are also ratio scales.
Some Basic Measures • Ratio • Proportion • Percentage • Rate • Six Sigma
Ratio • A ratio results from dividing one quantity by another. • The numerator and denominator are from two distinct populations and are mutually exclusive. • E.g., Number of males / Number of females x 100%
Proportion • In a proportion the numerator is a part of the denominator: • E.g., p = a / (a+b) • While a ratio is best used for two groups, a proportion is used for multiple categories of one group.
Percentage • A proportion becomes a percentage when it is expressed in terms of per hundred units (the denominator is normalized to 100). • Percentages can be misleading because they do not make the sample size clear. • The minimum sample size for reporting percentages is at least 30. • It’s best to show both percentages and actual numbers or sample sizes.
Example: Percentage Distributions of Defects across Project by Defect Type
Rate • Ratios, proportions, and percentages are static summary measures. • Rate is associated with the dynamics of the phenomena of interest. • Generally it is a measure of change in one quantity (y) per unit of another quantity (x); usually x is time. • E.g., Crude birth rate = (B/P) x K where B is the number of live births in a given calendar year, P is the mid-year population, and K is a constant, usually 1.000
Rate – Exposure to Risk • All elements in the denominator have to be at risk of becoming or producing the elements in the numerator. • A better measurement would be the general fertility rate in which the denominator is the number of women of childbearing age.
Risk Exposure with Respect to Quality • It is defined as opportunities for error (OFE) • The numerator is the number of defects of interest. • Therefore, Defect Rate = (Number of Defects / OFE) x K • In software, defect rate is usually defined as the number of defects per thousand source lines of code (KLOC) • This is a crude measure. WHY?
Six Sigma • Six sigma represents a stringent level of quality (3.4 defective parts per million). • It was made know by Motorola when it won the first Malcolm Baldrige National Quality Award. • It has become an industry standard as an ultimate quality goal. • Sigma (σ) is the symbol for standard deviation.
Six Sigma (Cont’d) • In a normal distribution, the area under the curve between plus and minus one standard deviation is 68.26%. • The area defined by plus/minus two standard deviations is 95.44%. • The area defined by plus/minus six standard deviations is 99.9999998%
Shifted Six Sigma • The six sigma value of 0.002 ppm is from the statistical normal distribution. • It assumes each execution of the production process will produce the exact distribution of parts or products centered with regard to the specification limits. • However, process shifts and drifts always result from variations in process execution. • According to research the maximum process shift is 1.5 sigma. • Accounting for the shift gives a six sigma value of 3.4 ppm.
Specification Limits, Centered Six Sigma, and Shifted Six Sigma
Six Sigma and Software Development • In software, six sigma in terms of defect level is defined as 3.4 defects per million lines of code of the software product over its lifetime. • Unfortunately, the operational definitions differ across organizations. • Some do not distinguish lines of code by language type.
Reliability and Validity • Concepts and definitions have to be operationally defined before measurements can be taken. • The logical questions to ask are; • How good are the operational metrics and the measurement data? • Do they really accomplish their task – measuring the concept we want to measure and doing so with good quality?
Reliability • It is the consistency of a number of measurements taken using the same measurement method on the same subject (precision) • If repeated measurements are highly consistent, or even identical, then the measurement method or operational definition has a high degree of reliability.
Reliability (Cont’d) • Reliability can be expressed in terms of the size of the standard deviations of the repeated mesurements. • When variables are compared, the ratio of the standard deviation to the mean (the index of variation or IV) is used. • IV = Standard Deviation / Mean
Validity • Validity refers to whether the measurement or metric really measures what we intend to measure. • When the measurement does not involve a higher level of abstraction, validity simply means accuracy. • For an abstract concept it is difficult to recognize whether a certain metric is valid or invalid in measuring it.
Types of Validity • Construct validity – the validity of the operational measurement or metric representing the theoretical construct. • Criterion-related validity – predictive validity, e.g., the relationship between test scores and actual performance. • Content validity – the degree to which a measure covers the range of meanings included in the concept.
Tension Between Reliability and Validity • For data to be reliable, the measurement must be specifically defined. • This may make it more difficult to represent the theoretical concept in a valid way.
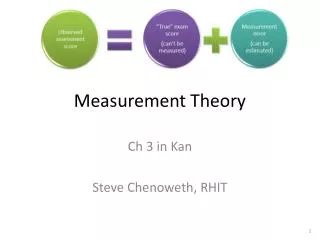
Measurement Errors • There are two types of measurement error: • Systematic • Random • Systematic errors are associated with validity • Random errors are associated with reliability
Systematic Errors • If the measurements do not equal the true value because of a systematic deviation (e.g., a scale being off by ten pounds), the error is a systematic error. • Measurement = True Value + Systematic Error + Random variations or M = T + s + e • The presence of a systematic error makes the measurement invalid.
Random Errors • If we eliminate systematic errors we have: M = T + e • That is, the measured value is different from the true value because of some random disturbance. • Since the disturbances are random, positive errors are jus as likely as negative errors. • Therefore, the expected value of e is zero, i.e., E(e) = 0
Random Errors (Cont’d) • From statistical theory about random error we can assume the following: • The correlation between the true score and the error term is zero. • There is no serial correlation between the true score and the error term. • The correlation between errors on distinct measurements is zero.
Random Errors (Cont’d) • From these assumptions it follows: E(M) = E(T) +E(e) = E(T) + 0 = E(T) = T • The smaller the variations in the error term, the more reliable the measurements.
Random Errors (Cont’d) M = T + e var(M) = var(T) + var(e) where var is variance Reliability = pm = var(T) / var(M) = [var(M) –var(e)] / var(M) = 1 – [var(e) / var (M)]
Assessing Reliability • Several ways of assessing reliability exist: • Test/retest method • Alternate-form method • Split-halves method • Internal consistency method • Using the test/retest method we would have: M1 = T + e1 M2 = T + e2 and as before pm = pm1m2 = var(T) / var(M)
Correction for Attenuation • One of the important uses of reliability assessment is to adjust correlations. • Given the observed correlation and the reliability estimates of two variables the formula for correction for attenuation is as follows: