Download
1 / 27
730 likes | 1.9k Views
Correlations. Measures of relationship. Key Concepts. Pearson Correlation interpretation limits computation graphing Factors that affect the Pearson Correlation Coefficient of Determination (r 2 ) – ‘ variance explained ’ Correlation vs. Causation. Correlations.

E N D
Correlations Measures of relationship
Key Concepts • Pearson Correlation • interpretation • limits • computation • graphing • Factors that affect the Pearson Correlation • Coefficient of Determination (r2) – ‘variance explained’ • Correlation vs. Causation
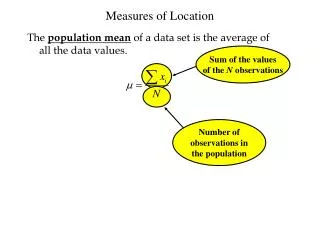
Correlations • A correlation measures a linear relationship between two variables
Correlation: Scatterplots Scatterplots are graphic representations of the relationship between two continuous variables
Correlation: Coefficients Correlation coefficients are number between -1.00 and +1.00 representing the relationship between two variables 0 +1 -1
Stop and think • What types of variables are correlated in education? • Can you provide some examples of both positive and negative relationships?
The Ugly Formula …the variance formula for r This formula calculates the correlation between X and Y It builds on your knowledge of variance; showing how the variation in X & Y along with the covariation between X & Y make up the Pearson correlation coefficient.
Example Step 1: Layout the Problem
Example Step 2: Compute the Mean for both variables Sum of X = 58 Number of X = 9 Mean of X = 6.44 Sum of Y = 530 Number of Y = 9 Mean of Y = 58.89
Step 3: Compute the difference of each score from its Mean Mean of X = 6.44 Mean of Y = 58.89 Note: The sum of (X-Xbar) should equal 0 and the sum of (Y-Ybar) should equal 0. Why?
Step 5: Sum the squares differences from the means Sum (X-Xbar)2 =58.22Sum (Y-Ybar)2 =5788.89
Step 6: Compute the cross-product of thedifferences (for the numerator)
Step 7: Sum the cross product of the differences Sum (X-Xbar)(Y-Ybar) =284.4444
Step 8: Collect the partial values together, and substitute each into the formula. Solve the formula. Sum (X-Xbar)2= 58.22 Sum (Y-Ybar)2= 5788.89 Sum (X-Xbar)(Y-Ybar) = 284.44
The value of r must be between -1 and +1 • Computed r = .49, which is between -1 and +1 • The sign of r is positive • The relationship among the two variables is positive • “In general, younger people weigh less than older people.” • “In general, older people weigh more than younger people.” • The magnitude of r is “moderate” • Although age and weight are related, the relationship is not very strong. Some of the variation in age has nothing to do with weight, and some of the variation in weight has nothing to do with age. Last Step: Check the computed r for reasonableness, then interpret the value (sign and magnitude)
Cautions • Variables with a curvilinear relationship will be underestimated if r is applied. • Size of the group does not affect the size of the correlation coefficient.
Effect Size • ES = the correlation coefficient, squared (r2) • The proportion of the total variance of one variable that can be associated with the variance in the other variable. • It is the proportion of shared or common variance between two variables. • Example: calorie intake & weightr = .60 • r2 = .36 or 36% CAL WEIGHT r2 = .36
Correlation & Causality • Correlation does not indicate causation • correlation indicates a relationship or association
Practice Compute the Pearson correlation and r squared value for the following example. Be sure to try to draw a rough sketch of a scatterplot to see if the relationship looks linear. X 3, 7, 8, 2, 5 Y 5, 8, 10, 3, 9 Interpret your results.
r = 27 / sqrt((26)(34)) r = 27 / 29.7 r = .908, r2 = .82
Key Points • Correlation is a measure of relationship, and ranges from -1 to 1. Sign indicates direction, and the coefficient indicates strength of relationship. • r2 represents the shared variance • Correlations do not imply causality