Download
1 / 14
140 likes | 234 Views
Cap and Trade 101. Marlon G. Boarnet Professor of Public Policy Director of Graduate Programs in Urban Planning and Development University of Southern California July 10, 2010. Externalities. Private Markets.

E N D
Cap and Trade 101 Marlon G. Boarnet Professor of Public Policy Director of Graduate Programs in Urban Planning and Development University of Southern California July 10, 2010
Externalities Private Markets • An externality occurs when a market transaction affects a party who neither pays not gets paid $ MPC MPC = marginal private cost MPB = marginal private benefit Q = quantity consumed (purchased) D = MPB Q (Televisions) Qp
Externalities Private Markets • An externality occurs when a market transaction affects a party who neither pays not gets paid $ = MSC MPC MPC = marginal private cost MPB = marginal private benefit Q = quantity consumed (purchased) = MSB D = MPB MSC = marginal social cost MSB = marginal social benefit Q (Televisions) Qp
Externalities Markets with Externalities • An externality occurs when a market transaction affects a party who neither pays not gets paid MSC $ MPC Social cost exceeds social benefit for these trades MPC = marginal private cost MPB = marginal private benefit Q = quantity consumed (purchased) D = MPB MSC = marginal social cost MSB = marginal social benefit Q* Q (Driving) Qp
Photos: SQ AQMD and Los Angeles Times
Regulatory Approaches Tax = (MSC – MPC) • Price Controls (taxes) • Example: Value Pricing on SR-91 • Quantity Controls (mandated limits) • Example: Clean Air Act compliance • Emission Clean-Up (mandated technology) • Examples: Catalytic Converters; Unleaded Fuel MSC $ MPC Social cost exceeds social benefit for these trades D = MPB Q* Q (Driving) Qp Mandated emissions limit
Efficiency of Regulatory Approaches (Theory) • Price Controls (taxes) and Quantity Controls (mandated limits) • Both lead to efficient externality reduction (to point where social costs of activity = social benefits) • Difference is in information available to regulator • Emission Clean-Up (mandated technology) • Can regulator “pick” the right technology? • Why not let market forces choose clean-up technology?
Efficiency of Regulatory Approaches (Practice) 27% pop growth LA County (7.4 to 9.5 million) Stage 1 days from 117 (in 1978) to 0 (late 1990s) Data: SC AQMD and US Census
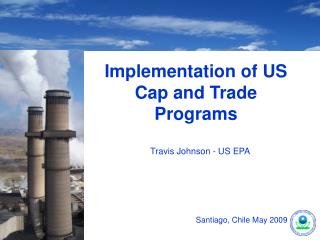
Market Based Regulatory Mechanisms Market based • Price Controls (taxes) • Quantity Controls (mandated limits) • Cap and Trade – Variation on Quantity Control • Emission Clean-Up (mandated technology) • Incentive vs. outcome regulation • Advantages of market based regulations • Creates incentives for clean-up • “self regulating” – uses incentives and markets to coordinate actions
Cap and Trade • Economy-wide cap on emissions (quantity regulation) • Similar to Clean Air Act concentration levels for traditional pollutants • Firms get emission permits, which can: • Be used for emissions, or • Sold to firms that want extra permits • Permits “depreciate” over time – cap binds more • Firms that can clean up inexpensively will do more cleanup to sell permits to “dirty” firms • More emission reduction from firms that can reduce emissions at lower cost
Example reduce four tons, two from each firm, cost = 1,100 two permits per firm and can trade, cost = 900 Firm 2 will sell a permit to Firm 1 at any price higher than $300 Firm 1 will buy a permit from Firm 2 at any price lower than $500
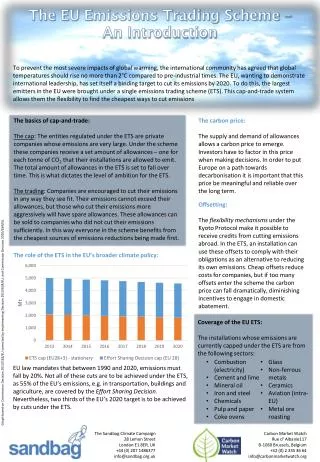
Does it work? • SO2 permit market, Clean Air Act Amendments of 1990; RECLAIM SCAQMD • Conditions for Cap and Trade to be successful and issues • No “hot spots” – location of emissions is no concern • Sufficient number of permit-holders for market to work • Neither a shortage nor surplus of permits • Initial permit allocation issues
ARB Cap and Trade • Economy-wide cap: 1990 CO2e emissions by 2020 • Price stability measures – reserve permits to offer on market and effort to not be too slack • Distribute early permits by allocation, auction later permits • Measures to reward prior energy efficiency with permit allocation • Economic impacts mostly distributional • 2.3% state GSP growth per year 2007-2020 vs. 2.4% “business as usual”
Use of Auctioned Permit Revenues • Reduce distorting taxes • Dividends to consumers • Clean energy? • High speed rail?