Download

1 / 20
200 likes | 465 Views
Emissions Trading (Cap and Trade). Kate Macauley. Economics of emissions trading Overview of the EU Emissions Trading Scheme (ETS). Cap and Trade. Quantity regulation: Total allowable emissions capped. Price determined by the market. Total number of allowances created to match cap

E N D
Emissions Trading(Cap and Trade) Kate Macauley
Economics of emissions trading • Overview of the EU Emissions Trading Scheme (ETS)
Cap and Trade • Quantity regulation: Total allowable emissions capped. Price determined by the market. • Total number of allowances created to match cap • Allowances may be traded on a market • Individual firms abate until MCA = Ppermit • The way you allocate the allowances does not impact the market price
Emissions Trading: Economics • Assumptions • Global pollutants: concerned with aggregate pollution, not with discharge location (SO2, NOx, CO2) • Competitive market • Cap set by regulatory body • (cap < emissions in base year) • Marginal cost of abatement (MCA) is positive and increasing
∆ABD+ ∆ACD > ∆AEF Therefore, it is more efficient to allow permits to be traded than to specify a uniform level of abatement across firms. Emissions Trading Graphically
Emissions Trading • cost of abatement • marginal cost of abatement is positive • marginal cost of abatement is increasing • uncontrolled emissions for firm i in the base year • abatement by firm i • Individual firms *Sankar, U. (2001). Environmental Economics. New Delhi: Oxford University Press.
Therefore, we have the following cost minimization problem subject to the pollution cap restraint: aggregate level of pollution in base year Pollution cap and Subject to: *Sankar, U. (2001). Environmental Economics. New Delhi: Oxford University Press.
Solution: Firms abate until MCA = ppermit If the market is competitive, the firms are price takers and p is determined by the market. Then for the individual firm: Minimize (xi): ci(xi) + p(ei-xi) Solution: ci’ = p for all i *Sankar, U. (2001). Environmental Economics. New Delhi: Oxford University Press.
Emissions Trading Graphically Auction versus free allocation
EU ETS: Emissions Trading Scheme • Proposed in 2001. First carbon dioxide cap-and-trade program • Trial period: 2005-2007. Second trading period: 2008-2012 • Aim to meet obligations outlined by the Kyoto Protocol during the 2008-2012 trading period, not during the trial period. Plan to continue after 2012 (post-Kyoto) • Set an absolute cap on CO2 emissions on 12,000 facilities in the EU. • Tradable allowances distributed equal to cap quantity. Most allowances freely allocated. • Facilities measure and report CO2 emissions. One allowance per ton of CO2 emitted. • Initially only included 40% of total GHG emissions. Limited to certain sectors (power, combustion facilities, certain industries -- not transportation or buildings). Plan to expand over time. Ellerman, D.A. & Joskow, P.L. (2008). The European Union’s Emissions Trading System in perspective.” Pew Center on Global Climate Change.
ETS cont. Cap-setting process: Initial cap = Sum of 25 separate decisions across member states. Each individual cap approved by European Commission. Unknown long-term trajectory for cap. Caps determined again each trading period. First period: 2005-2007 Second period: 2008-2012 Third Period: 2013-2020 annual cap declines annually by 1.74 percent across EU ETS 20% below 1990 levels by 2020 Ellerman, D.A. & Joskow, P.L. (2008). The European Union’s Emissions Trading System in perspective.” Pew Center on Global Climate Change.
Linking Directive • For a specified amount of abatement, firms can comply through carbon offsets (amount set by individual member states) • CDM Clean Development Mechanism (established by Kyoto) • Limited to prevent over-supply • Not significant during trial period, but more important for future periods • Concern: Would the offsets have occurred regardless of the CDM? Ellerman, D.A. & Joskow, P.L. (2008). The European Union’s Emissions Trading System in perspective.” Pew Center on Global Climate Change.
ETS Trial Period Concerns Price Volatility Windfall Profits Overallocation of permits Ellerman, D.A. & Joskow, P.L. (2008). The European Union’s Emissions Trading System in perspective.” Pew Center on Global Climate Change.
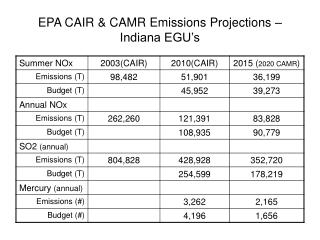
1. Price Volatility Ellerman, D.A. & Joskow, P.L. (2008). The European Union’s Emissions Trading System in perspective.” Pew Center on Global Climate Change.
Price volatility cont. Graph explanation • Market provides one price signal for MCA • Dec. 2007 line shows futures contracts scheduled for delivery in Dec. ‘07 • Dec. 2008 line represents contracts for delivery in Dec. ‘08 for second trading period • Sharp price decline after September ‘06 because of restriction on trading between 1st and 2nd periods (*banking and borrowing) • Sharp decline in April ‘06 after release of 2005 emissions reporting. Several member states reported lower emissions than expected. • Expected aggregate emissions determines actual demand for allowances. When the data was first released, the market adjusted expected price with the actual demand. Because emissions were lower than expected, the price of allowances fell. This effect is strongest after the first release of information. Ellerman, D.A. & Joskow, P.L. (2008). The European Union’s Emissions Trading System in perspective.” Pew Center on Global Climate Change.
Ellerman, D.A. & Joskow, P.L. (2008). The European Union’s Emissions Trading System in perspective.” Pew Center on Global Climate Change.
Windfall profits • Higher electricity prices and higher corporate profits from free allocation of allowances. • The market price reflects the opportunity cost of the allowances • Solution: auction allowances • This would not impact electricity prices • Raises government revenue Ellerman, D.A. & Joskow, P.L. (2008). The European Union’s Emissions Trading System in perspective.” Pew Center on Global Climate Change.
Overallocation • Member states allocated too many permits during the trial period to create a non-binding EU cap • Second period EU cap will be about 13 percent lower than the first period cap and 6 percent lower than comparable 2005 emissions • Still some abatement during trial period - because short-term incentive to abate from high prices • Estimate: between 2 percent and 5 percent of covered emissions abated annually during trial period Ellerman, D.A. & Joskow, P.L. (2008). The European Union’s Emissions Trading System in perspective.” Pew Center on Global Climate Change.
Ellerman, D.A. & Joskow, P.L. (2008). The European Union’s Emissions Trading System in perspective.” Pew Center on Global Climate Change.
Changes Looking Forward Banking and Borrowing: inter-period banking of permits allowed. Majority of permits auctioned, instead of freely allocated Decentralized nature of the system will become more centralized (ie. Monitoring, controlling) Lower cap Ellerman, D.A. & Joskow, P.L. (2008). The European Union’s Emissions Trading System in perspective.” Pew Center on Global Climate Change.