Download
1 / 26
260 likes | 591 Views
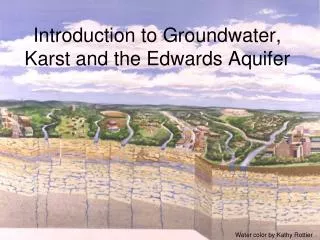
Assessing Mining Impacts Groundwater Modeling in Karst Aquifers. Todd R. Kincaid, Ph.D. Hazlett-Kincaid, Inc. H2H Associates, LLC www.h2hmodeling.com Timothy J. Hazlett, Ph.D. Ardaman Associates www.ardaman.com. Problem / Purpose.

E N D
Assessing Mining ImpactsGroundwater Modeling in Karst Aquifers Todd R. Kincaid, Ph.D. Hazlett-Kincaid, Inc. H2H Associates, LLCwww.h2hmodeling.com Timothy J. Hazlett, Ph.D. Ardaman Associates www.ardaman.com
Problem / Purpose • “Limestone areas are bad places for limerock quarries”Environmental Consultant Pennsylvania • If our society needs quarry products, then the challenge is to locate them and manage them such that environmental impacts are minimized and repaired to every extent possible after the quarry closes. • Impact assessments are often obscure and not accessible • Describe how modeling contributes to impact assessments • Describe how I think it SHOULD be used to assess impacts
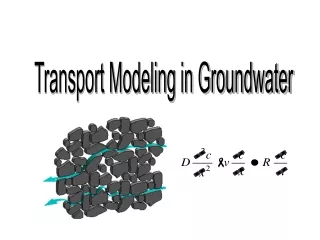
What is a Groundwater Model? • Groundwater models are tools most often used to make predictions about future impacts to groundwater resources associated with proposed activities or existing problems. • They can be: • analytical (meaning mathematically solvable), • stochastic (meaning statistically solvable), • numerical (meaning solvable through iteration), • or some combination of the three. • They are often required by State and Federal regulatory agencies for impact and contamination assessments specifically because of their ability to predict the future. • The problem is that most of these models are based on simplifying assumptions that render the resulting predictions dangerously inaccurate particularly when applied to karst aquifers.
Basic Conceptualizations Most commonly assumed Most commonly true
Describing an Aquifer Flow Through A Porous Media Aquifer Recharge Isotropic & Homogeneous Discharge
Describing an Aquifer Flow Through A Karst Aquifer Recharge Heterogeneous - Anisotropic Discharge
Why Does it Matter? Wakulla Springs Basin – North Florida Simple World • Simple models produce simple simulations • Produce very generalized estimations of groundwater flow directions • Under-estimate velocities • Misrepresent connections Real World
Water Budget / Flow Chart • Models produce predictions of groundwater levels from which all other things are calculated • Calibration is the process of matching model predicted conditions to observed conditions • Typically only done for groundwater levels • In Karst it is critical that models are also calibrated to • spring flows (regional) • observable conduit velocities (tracer tests, observed responses to storms or collapse, etc)
Sinkhole Overview • 19 sinkholes in current model • 15 known to exist • 4 assumed • Sinkhole systems can be grouped by three dominate sinks • Santa Fe River Sink (largest) • Capacity estimated at 1000’s of cfs • Large volume conduit network connects to Santa Fe Rise • Mill and Rose Creek sinks • Capacities estimated up to 100 cfs • Large volume conduits extend downstream from sinks • All other sinks estimated to have capacities > 30 cfs • Alligator and Waters Lakes known to drain through low capacity sinks during drought years • Watermelon Pond, Burnetts Lake, Lake Wilson, and Lake Lona assumed to have similar sinks
Springs Overview • 18 Springs in current model • Santa Fe River Rise is Largest Spring • Discharge in 1000’s of cfs • Direct flow from Santa Fe Sink • Hornsby second largest spring • Discharge up to 250 cfs • Majority of discharged believed to be sinking surface water • Can go dry during droughts (fall, 2002) • Other springs part of three groups • Ichnetuckenee • Ginnie • Devil’s Ear
1 2 Defining Conduits Incorporating Cave and Karst Pathways • Hand-contoured potentiometric surface • Composite data - May 2005 • lines colored by elevation • depressions assumed to reflect presence of conduits/caves • Projected & known caves & pot surface • Old Bellamy only cave shown • Traced pathways based on KES data 1) Rose Sink cave – Ichetucknee group 2) Mill Creek cave – Hornsby spring • Projected caves - follow potentiometric lows - connect swallets to springs or to established pathways • Connections • sinking streams to Hornsby spring, Ichetucknee springs, and Santa Fe rise • Ginnie, Twin, Dogwood, Gilchrist Blue, Lilly, Poe not connected to sinks • July & Devil’s Eye not yet in model
Cave vs No Cave Results Evaluation Approach – Preliminary Comparisons • Develop independent models • One with no caves • One with caves • Compare results using calibration as the measuring stick • No-cave model similar to standard approach • Cave model significantly more thorough
Cave vs No Cave Results No-Cave Model Cave Model
Model Comparison: Southern Area Cave Model No-Cave Model Quarry Area • models not very comparable • no-cave model shows large area of anomalously elevated head (+ 3-5 meters) / okay in confined areas • cave model is well calibrated everywhere • cave model shows quarries in springshed
Example: Corkscrew Mine Lee County, Florida – 2003 Quarry Permit Application • Define impacts to the water table near the mine due to the removal of mined materials – operational stage • How will they change under proposed dewatering? • What is the magnitude of these impacts and how long might they last? • How might karst features impact the groundwater flow field? Dewatered Quarry Schmidt Property N Copyright Hazlett-Kincaid, Inc. 2003. All rights reserved.
Results: Dewatering Scenario • Drawdown indicated from unperturbed condition to 36 months of dewatering at 25’ b.l.s. • Recharge trench included • Perimeter of mine • Flux limited • Model was designed such that effect of trenches could be assessed • Larger scale with less assumptions yields different predictions Copyright Hazlett-Kincaid, Inc. 2003. All rights reserved.
Potential Impact of Karst • Hypothetical conduit extending from wetland discharges to quarry • Conduit assumed to be in the limestone beneath the quarry floor • Flow concentrated along conduit • Drains the water table in a localized fashion • Lower heads in conduits • Higher flow rate in hotter colors • Same calibration but different prediction of where the impacts will be felt N Copyright Hazlett-Kincaid, Inc. 2003. All rights reserved.
Corkscrew Modeling Results • The modeled excavation of the pit demonstrates a drawdown in the surficial aquifer. • The maximum drawdown is about 10 cm (~1 ft) under the Schmidt property, at the northeast corner. • The water table rebounds to near equilibrium conditions in about 150 days. • The water table will not reach full equilibrium over the long term, due to increased loss from the aquifer from evaporative flux from the pit. • Substantially greater groundwater drawdown will occur offsite of the mine property if mechanical dewatering is implemented as described in the permit application (recently withdrawn) • The recharge scenario as described in the permit application will not significantly mitigate the drawdown effect • Modeling results are dependent on the initial conceptualization and model design • Should be designed to match real-world as closely as possible Copyright Hazlett-Kincaid, Inc. 2003. All rights reserved.
Example: Hercules Quarry Preliminary No Karst Model Karst Model • Localized Cone of Depression • No account for exchange with nearby creek • Larger Cone of Depression • Conduit exchange with creek included
Summary / Conclusions • The quality of an impact assessment is heavily determined by the accuracy and scale of the conceptual model on which they’re based • Florida limestones are predominantly karst • Conceptual models therefore need to be large enough to account for local and regional hydrologic features (recharge & discharge) • Modeling can be an effective tool for predicting impacts IF they’re based on reasonably accurate conceptualizations
Summary / Conclusions • Need for basin-wide characterization models • Continuously updated with new data • Goal: provide ongoing background levels – ie what is the pre-mining condition from which impacts can be addressed • Incorporate high frequency data • Publically available & transparent • Required foundation for all local-scale investigations & assessments • Need for comprehensive look at water use throughout the life of mine • Consumptive use, recharge, discharge, reclaimed use (Water Balance Evolution) • What is the post-operation mine going to be used for?
Summary / Conclusions • Quarries are (most likely) an unwanted given • Must look at how we manage them to ensure the best possible outcome for the environment • Where they go, how big they are, how long they operateAll these factors can and probably will impact groundwater resources and should therefore be at least partly determined by comprehensive and consistent regional characterizations • How can we get these comprehensive characterization models done? • Public private partnerships • Partially publically funded / partially funded by quarries