Download
1 / 42
440 likes | 473 Views
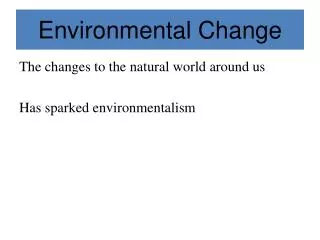
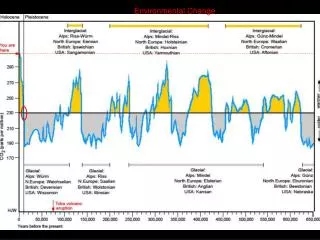
Explore environmental problems like climate change, biodiversity loss, and pollution caused by human stressors. Learn how interconnected issues affect each other and discover potential solutions to address these challenges.

E N D
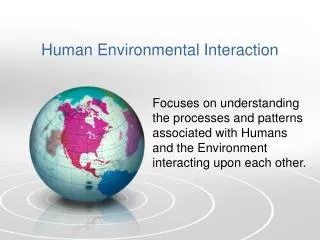
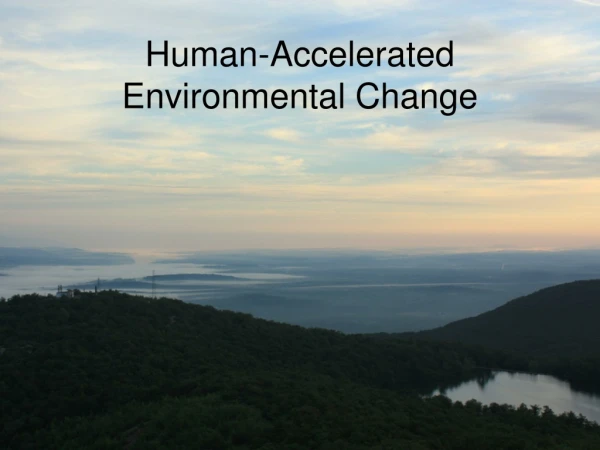
Human-Accelerated Environmental Change
What are some environmental problems caused by human stressors?
What are some environmental problems caused by human stressors? How do these problems impact each other?
Infectious disease Global climate change Loss of biodiversity Land-use changes Loss of ozone layer Humans Invasive species introductions Pollution Human-Accelerated Environmental Change Modified after Likens 2004, Water, Air &Soil Pollution
1CE 300 million people
1000 CE 310 million people
1800 CE 1999 – 6 billion people 1987 – 5 billion people 2050 – 9 billion 1974 – 4 billion people 1960 – 3 billion people 1927 – 2 billion people A.D. 0 - 300 million people 1 billion people
1927 1999 – 6 billion people 1987 – 5 billion people 2050 – 9 billion 1974 – 4 billion people 1960 – 3 billion people A.D. 0 - 300 million people 2 billion people
1960 1999 – 6 billion people 1987 – 5 billion people 2050 – 9 billion 1974 – 4 billion people A.D. 0 - 300 million people 3 billion people
1974 1999 – 6 billion people 1987 – 5 billion people 2050 – 9 billion A.D. 0 - 300 million people 4 billion people
1987 5 billion people
1999 2050 – 9 billion 6 billion people
2050 9 billion people
Let’s talk about the U.S. What percent of the world’s population lives in the United States? (your perception)
Global Trend #2: More People…More Land Use Change Paraguay Google Earth Animations - Land use changes since 1984 (http://bit.ly/18nQTvb)
What about us? What do you think was here 70 years ago? How do you think it has changed?
1936: Rt 9, site of current Galleria mall, small quarry visible next to river
2004: Poughkeepsie Galleria on right hand side, gravel quarry next to river
Ossining, 1925 Use the small lakes in the upper left hand corner as reference.
More land was converted to cropland in the 30 years after 1950 than in the 150 years between 1700 and 1850.
Iowa Tan: Prairie 1850s Gray: Row Crops 1990s Compiled from Landsat Thematic Mapper satellite imagery, Iowa Dept. of Natural Resources.
Iowa, 1990’s: Non-food row crops Nature Publishing Group
Corn requires a lot of nitrogen! www.usgs.gov
Land Use Change Pollution www.usgs.gov
How much do we consume? Ecological Footprint ~ 22% of the world’s resources World Population ~ 4.7% of the world’s population
Population Source: Swaney et.al 2006
Mid Hudson Valley counties are growing in population, and forest fragmentation is a big problem. Scenic Hudson
Glacial melting Air temperatures in Central Park
Land Use Change + Climate Change = Disease Increase Ragweed Pollen Production g/plant Ziska, 2007 280 370 600 ppm www.usbr.gov
Land Use Change = Biodiversity loss NOAA % Threatened NYSDEC Taxa IUCN Red List Nature Publishing Group
Inbocht Bay, south of Catskill on the Hudson River, covered in water chestnut (Trapa natans) Photos courtesy of IES
Climate Change + Land use + Invasive Species = Yet more biodiversity loss
Amphibians Are Declining Globally The species in these 5 categories represent 39% of amphibian species globally!
Your Turn • Summarize the major changes in the environment • How does each problem affect the others? • What might be some possible solutions?