Download
1 / 64
640 likes | 736 Views
Chapter 16. Nonrenewable Energy. Questions for Today. What are the Two Types of Energy Resources? How much solar energy is used compared to commercial energy? Compare and Contrast the Commercial Energy used by the world versus the US.

E N D
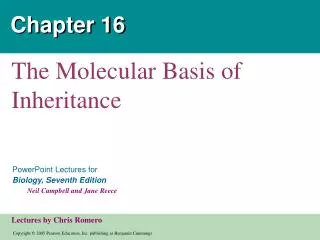
Chapter 16 Nonrenewable Energy
Questions for Today • What are the Two Types of Energy Resources? • How much solar energy is used compared to commercial energy? • Compare and Contrast the Commercial Energy used by the world versus the US. • How much nonrenewable energy is used compared to renewable energy resources? • What is Net Energy Use?
Core Case Study: How Long Will the Oil Party Last? • Saudi Arabia could supply the world with oil for about 10 years. • The Alaska’s North Slope could meet the world oil demand for 6 months (U.S.: 3 years). • Alaska’s Arctic National Wildlife Refuge would meet the world demand for 1-5 months (U.S.: 7-25 months).
Core Case Study: How Long Will the Oil Party Last? • We have three options: • Look for more oil. • Use or waste less oil. • Use something else. Figure 16-1
TYPES OF ENERGY RESOURCES • About 99% of the energy we use for heat comes from the sun and the other 1% comes mostly from burning fossil fuels. • Solar energy indirectly supports wind power, hydropower, and biomass. • Solar energy comes from the nuclear fusion of hydrogen atoms that make up the sun’s mass. • Life on earth is made possible by a gigantic nuclear fusion reactor that fortunately is safely located in space about 150 million kilometers away.
TYPES OF ENERGY RESOURCES • About 76% of the commercial energy we use comes from nonrenewable fossil fuels (oil, natural gas, and coal) with the remainder coming from renewable sources. • Commercial Energy sold in the marketplace makes up the remaining 1% of energy we use to supplement the earth’s direct input of solar energy.
TYPES OF ENERGY RESOURCES • Nonrenewable energy resources and geothermal energy in the earth’s crust. Figure 16-2
Oil and natural gas Floating oil drilling platform Coal Oil storage Geothermal energy Contour strip mining Oil drilling platform on legs Hot water storage Oil well Gas well Geothermal power plant Pipeline Mined coal Valves Area strip mining Pipeline Pump Drilling tower Underground coal mine Impervious rock Oil Natural gas Water Water is heated and brought up as dry steam or wet steam Water Water penetrates down through the rock Coal seam Hot rock Magma Fig. 16-2, p. 357
TYPES OF ENERGY RESOURCES • Commercial energy use by source for the world (left) and the U.S. (right). Figure 16-3
World Nuclear power 6% Hydropower, geothermal, solar, wind 7% Natural gas 21% RENEWABLE 18% Biomass 11% Coal 22% Oil 33% NONRENEWABLE 82% Fig. 16-3a, p. 357
United States Hydropower geothermal, solar, wind 3% Natural gas 23% Nuclear power 8% RENEWABLE 8% Coal 23% Biomass 4% Oil 39% NONRENEWABLE 93% Fig. 16-3b, p. 357
TYPES OF ENERGY RESOURCES • Net energy is the amount of high-quality usable energy available from a resource after subtracting the energy needed to make it available. • Net energy is like your net spendable income – your wages minus taxes and job-related expenses. • Suppose for every 10 units of energy in oil produced from the ground, we use or waste 8 units of energy to find, extract, process, and transport the oil to users. How much energy can we use?
HOW DO WE EXPRESS NET ENERGY • We can express net energy as a ratio. • Energy gained/Energy used= Net Energy Ratio • The Higher the ration more Net Energy Gained. • Good thing • The Lower the ration the less energy gained. • Bad • Worse if it’s less than 1. Why?
Net Energy Ratios • The higher the net energy ratio, the greater the net energy available. Ratios < 1 indicate a net energy loss. Figure 16-4
Space Heating Passive solar 5.8 Natural gas 4.9 Oil 4.5 Active solar 1.9 Coal gasification 1.5 Electric resistance heating (coal-fired plant) 0.4 Electric resistance heating (natural-gas-fired plant) 0.4 Electric resistance heating (nuclear plant) 0.3 High-Temperature Industrial Heat Surface-mined coal 28.2 Underground-mined coal 25.8 Natural gas 4.9 Oil 4.7 Coal gasification 1.5 Direct solar (highly concentrated by mirrors, heliostats, or other devices) 0.9 Transportation Natural gas 4.9 Gasoline (refined crude oil) 4.1 Biofuel (ethyl alcohol) 1.9 1.4 Coal liquefaction Oil shale 1.2 Fig. 16-4, p. 358
Questions for Today: • What is Crude Oil? • How is Oil found, extracted, and refined? • Who is in charge of the World’s Oil? • Who are the world’s Major Oil Consumers? • What are the trade-offs for using Conventional Oil?
OIL • Crude oil (petroleum) is a thick liquid containing hydrocarbons that we extract from underground deposits and separate into products such as gasoline, heating oil and asphalt. • Also known as conventional oil and light oil. • Only 35-50% can be economically recovered from a deposit. • As prices rise, about 10-25% more can be recovered from expensive secondary extraction techniques. • This lowers the net energy yield.
Steps to finding and extracting crude oil • Locate the Oil using satellite data, conduct ground and air surveys, drill rock cores, and seismic surveys. • Oil is trapped in permeable rocks like limestone and sandstone like water in a sponge. • To extract oil, a well is drilled into the deposit. • Drills can extend as far as 4 miles. • Oil almost always squirts out due to pressure in the earth.
Extracting Oil • After a period of time, the pressure lessens and it require more energy to pump out the oil. • When the pressure disappears and production starts declining, we have passed the half way point or peak production of a well. • Lowers net energy ratio • What left over is called, Heavy Crude Oil • Usual wells have a lifetime of a decade
OIL • Refining crude oil: • Based on boiling points, components are removed at various layers in a giant distillation column. • The most volatile components with the lowest boiling points are removed at the top. Figure 16-5
Gases Gasoline Aviation fuel Heating oil Diesel oil Naptha Heated crude oil Grease and wax Furnace Asphalt Fig. 16-5, p. 359
Oil refining • Refining oil decreases its net energy yield. • Accounts for about 8% of all US energy consumption. • Most of the products we used today are connected to oil. • Products of oil distillation are called petrochemicals • PLASTIC • Paints • Medicine • Production of a typical desktop computer consumes 10 times its weight in fossil fuels, mostly oil.
Who controls the Oil? • OPEC • Organization of Petroleum Countries • 12 Countries make up OPEC • Angola • Algeria • Indonesia • Iran • Iraq • Kuwait • Libya • Nigeria • Qatar • Saudi Arabia • UAE • Venezuela
Who controls the Oil? • OPEC controls 78% of the world’s crude oil. • Saudi Arabia and Venezuela controls 70% of that oil. • Saudi Arabia has the world’s largest Oil Reserves (25%) • Canada is Second with 15 % • Iraq has 11% • UAE 9.3% • Kuwait 9.2% • Iran 8.6%
Who needs the most Oil? • Top three oil CONSUMERS • US, China, and Japan • US imports 60% of it’s Oil • China Imports 33% • Japan imports 95%! • After Global Oil Production Peaks, oil prices will rise and could threaten the lifestyles and economies of oil-addicted countries that have not switched to alternative fuel sources.
OIL • Inflation-adjusted price of oil, 1950-2006. Figure 16-6
Oil price per barrel ($) (2006 dollars) Year Fig. 16-6, p. 361
Case Study: U.S. Oil Supplies • The U.S. – the world’s largest oil user – has only 2.9% of the world’s proven oil reserves. • U.S oil production peaked in 1974 (halfway production point). • About 60% of U.S oil imports goes through refineries in hurricane-prone regions of the Gulf Coast.
OIL • Burning oil for transportation accounts for 43% of global CO2 emissions. Figure 16-7
Trade-Offs Conventional Oil Advantages Disadvantages Ample supply for 42–93 years Need to find substitutes within 50 years Low cost (with huge subsidies) Artificially low price encourages waste and discourages search for alternatives High net energy yield Easily transported within and between countries Air pollution when burned Low land use Technology is well developed Releases CO2 when burned Efficient distribution system Moderate water pollution Fig. 16-7, p. 363
Questions for Today • What is Natural Gas? • What are the Tradeoffs for using Natural Gas? • What are the Four Types of Coal? • What are the Tradeoffs for using Coal?
NATURAL GAS • Natural gas a mixture of gases, of which 50% - 90% are methane. • Two Types • Conventional – found above crude oil reservoirs • Unconventional - Coal beds and bubbles of methane trapped in ice crystals deep under the arctic permafrost and beneath deep-ocean sediments • When a natural gas-field is tapped, gasses are liquefied and removed as liquefied petroleum gas (LPG). • Lower temperature and increase pressure of the container
Economics of Natural Gas • Only 20% is imported to the US. • 60% for Oil. • Burns cleaner than oil and coal. • Able to run medium sized turbines for electricity • Twice the energy efficiency of Coal Plants and Nuclear Plants.
NATURAL GAS • Russia and Iran have almost half of the world’s reserves of conventional gas, and global reserves should last 62-125 years. • Natural gas is versatile and clean-burning fuel, but it releases the greenhouse gases carbon dioxide (when burned) and methane (from leaks) into the troposphere.
NATURAL GAS • Some analysts see natural gas as the best fuel to help us make the transition to improved energy efficiency and greater use of renewable energy. Figure 16-11
Trade-Offs Conventional Natural Gas Advantages Disadvantages Ample supplies (125 years) Nonrenewable resource High net energy yield Releases CO2 when burned Low cost (with huge subsidies) Methane (a greenhouse gas) can leak from pipelines Less air pollution than other fossil fuels Lower CO2 emissions than other fossil fuels Difficult to transfer from one country to another Moderate environmental impact Shipped across ocean as highly explosive LNG Easily transported by pipeline Sometimes burned off and wasted at wells because of low price Low land use Good fuel for fuel cells and gas turbines Requires pipelines Fig. 16-11, p. 368
COAL • Coal is a solid fossil fuel that is formed in several stages as the buried remains of land plants that lived 300-400 million years ago. • Coal is burned in power plants to generate 62% of the world’s Electricity • It is also burned to make ¾ of the world’s steel. • 4 types of “Coal”: • Peat • Lignite (Brown Coal) • Bituminous (Soft Coal) • Anthracite (Hard Coal) – 98% Carbon Figure 16-12
Increasing heat and carbon content Increasing moisture content Peat (not a coal) Lignite (brown coal) Bituminous (soft coal) Anthracite (hard coal) Heat Heat Heat Pressure Pressure Pressure Highly desirable fuel because of its high heat content and low sulfur content; supplies are limited in most areas Extensively used as a fuel because of its high heat content and large supplies; normally has a high sulfur content Partially decayed plant matter in swamps and bogs; low heat content Low heat content; low sulfur content; limited supplies in most areas Stepped Art Fig. 16-12, p. 368
COAL • Coal reserves in the United States, Russia, and China could last hundreds to over a thousand years. • The U.S. has 27% of the world’s proven coal reserves, followed by Russia (17%), and China (13%). • In 2005, China and the U.S. accounted for 53% of the global coal consumption.
COAL • Coal is the most abundant fossil fuel, but compared to oil and natural gas it is not as versatile, has a high environmental impact, and releases much more CO2 into the troposphere. Figure 16-14
Trade-Offs Coal Advantages Disadvantages Ample supplies (225–900 years) Severe land disturbance, air pollution, and water pollution High net energy yield High land use (including mining) Low cost (with huge subsidies) Severe threat to human health Well-developed mining and combustion technology High CO2 emissions when burned Air pollution can be reduced with improved technology (but adds to cost) Releases radioactive particles and toxic mercury into air Fig. 16-14, p. 370
COAL • Coal can be converted into synthetic natural gas (SNG or syngas) and liquid fuels (such as methanol or synthetic gasoline) that burn cleaner than coal. • Costs are high. • Burning them adds more CO2 to the troposphere than burning coal.
COAL • Since CO2 is not regulated as an air pollutant and costs are high, U.S. coal-burning plants are unlikely to invest in coal gasification. Figure 16-15
Trade-Offs Synthetic Fuels Advantages Disadvantages Large potential supply Low to moderate net energy yield Higher cost than coal Vehicle fuel Requires mining 50% more coal Moderate cost (with large government subsidies) High environmental impact Increased surface mining of coal Lower air pollution when burned than coal High water use Higher CO2 emissions than coal Fig. 16-15, p. 371
Questions for Today: • What is Nuclear Energy? • What are parts on Nuclear Reactor and Nuclear Power Plant? • What are some Tradeoffs for using Nuclear Energy? • What is a Dirty Bomb? • What are some suggested ways to deal with Nuclear Waste?
NUCLEAR ENERGY • When isotopes of uranium and plutonium undergo controlled nuclear fission, the resulting heat produces steam that spins turbines to generate electricity. • Nuclear Energy is nonrenewable and very clean, air pollution-wise, fuel source. • Emits 1/6th as much CO2 as coal plants. • Very little Particulate matter, i.e. smoke.
PARTS OF A NUCLEAR REACTOR • Most Nuclear Reactors in the World are Light Water Reactors. • Core – Most important part of the reactor • Contains 35,000 – 70,000 long, thin fuel rods, packed with radioactive fuel pellets. • Each pellet is 1/3 the size of a cigarette butt • Each pellet contains the energy equivalent to 0.9 metric ton of coal or 4 barrels of crude oil.
PARTS OF A NUCLEAR REACTOR • Moderator – Neutron absorbing material that slows down the neutrons emitted by the fission process to keep the chain reaction going. • Moderators are usually water, but can be solid graphite, or heavy water. • Control Rods – Rods that are moved in and out of the reactor core to absorb neutrons.