Download
1 / 15
150 likes | 250 Views
Simulating PM 2.5 with CMAQ A Decade in Review. Prakash Bhave U.S. Environmental Protection Agency CMAS Conference Chapel Hill, North Carolina. Acknowledgements: many EPA colleagues & external collaborators. Motivating Questions. Has CMAQ performance for PM 2.5 improved?

E N D
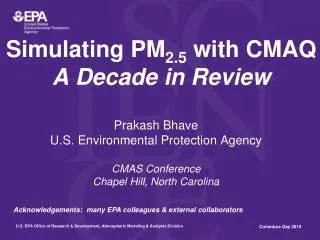
Simulating PM2.5 with CMAQA Decade in Review Prakash Bhave U.S. Environmental Protection Agency CMAS Conference Chapel Hill, North Carolina Acknowledgements: many EPA colleagues & external collaborators
Motivating Questions Has CMAQ performance for PM2.5 improved? Which refinements to the modeling system contributed most? 1
Emissions MET Processes PBL Height Clouds SOA Source/SinkProcesses Wet Removal Chem/AeroProcesses SO4 AqChem Precip DryDep N2O5/NO3˙HetChem OC Aging WS, WDIR AerosolThermo Gas Mechs Coagulation Temp, RH Nucleation Processes Affecting Modeled PM2.5 HIGH Potential to Improve Model Performance LOW Availability of Lab or Field Measurements SPARSE ABUNDANT
Motivating Questions Has CMAQ performance for PM2.5 improved? Which refinements to the modeling system contributed most? What PM2.5 problems remain? See Heather Simon’s talk here at 10:00am today See George Pouliot’s talk tomorrow at 10:40am in Redbud Rm See Heather Simon’s talk tomorrow at 11:20am, right here 3
Historical & Regulatory Context • Photochemical air quality models of PM2.5 size & composition • Major developments: 1975 – 2000 • Limited applications: 2-day episodes, small domains • By 2000, new U.S. regulations warranted nationwide PM2.5 simulations for full-year periods • 1997: EPA issues PM2.5 standard (15 μg m-3 annual avg.) • 1999: Regional Haze Rule issued • April 2001: EPA completed 1st full-year simulation across U.S. • CMAQ version 4.1 • Simulation period: 1996 • Meteorology: MM5 with 23 vertical layers • Horizontal grid size: 36 km • Vertical grid: 8 layers, 150m lowest layer • 4 quarters run concurrently on 4 CPUs for 14 days • Enterprise 450 Sun Workstations (400 MHz) See posters in the lobby: Wyat Appel (12km U.S.) Pius Lee (4km U.S. domain)
NMB = 8% CMAQ v4.1 Evaluation 1996 Annual-Average PM2.5 (μg m-3) Model Results (CMAQ) Observations (IMPROVE network) Plot provided by C. Jang
CMAQ v4.1 Evaluation PM2.5 Components (μg m-3) SO4 NO3 Model Results (CMAQ) • Implications:R&D efforts should focus on improving CMAQ for • NO3 (winter) • OC (summer) OC Observations (IMPROVE) Plot provided by C. Jang
PM2.5 Nitrate (μg m-3) Winter 2002 – 2006 CMAQ v4.7 Gilliland et al. Atmos.Env. 2006 Davis et al. ACP 2008 IMPROVE Observations Winter NO3- – Success! • Winter nitrate problem “solved” by improving: • Deposition algorithms • Meteorological input • Emissions input (NH3) • Chemical mechanism (N2O5 hydrolysis)
Summer Organic PMModerate Success 2004 – 2006: Assess and Improve POA 2005 – 2008: Revise SOA Treatment
1999 NEIv1 1999 NEIv3 CMAQ ÷ Observed Concentration Estimate Wildfire Emissions • 2004: wildfire emissions added to U.S. National Emission Inventory (NEI) based on state- and month-specific acreage burned • More recent inventories use satellite observations to allocate fire emissions to specific grid cells and time periods where burns occurred (e.g., Roy et al., 2007) Bhave et al. ES&T 2007
SOA: Fundamental Research • 2000 – 2008: EPA recognized need for SOA research • Science To Achieve Results (STAR) grant program • Funded 25+ projects totalling >$10M • Grantees include: Seinfeld, Pankow, Robinson, Donahue, Jimenez, Turpin, & many more • “Unsung heroes” – Darrell Winner, Sherri Hunt • Results • New formation pathways elucidated • SOA yields better understood
Organic PM2.5 cloud water ∙OH SV_ALK long alkanes SV_TOL1 SV_TOL2 ∙OH/NO AALK high-yield aromatics ∙OH/HO2 AORGC ATOL1, ATOL2 SV_XYL1 SV_XYL2 low-yield aromatics AOLGA ∙OH ∙OH/NO dissolution AXYL1, AXYL2 ATOL3 ∙OH/HO2 AXYL3 ABNZ1, ABNZ2 SV_BNZ1 SV_BNZ2 ABNZ3 ∙OH/NO glyoxal methylglyoxal POA benzene AOLGB ATRP1, ATRP2 ∙OH/HO2 SV_TRP1 SV_TRP2 ASQT AISO3 ∙OH,O3 O3P, NO3 H+ monoterpene AISO1, AISO2 SV_SQT CMAQ v4.7 VOCs ∙OH,O3, or NO3 ANTHROPOGENIC EMISSIONS sesquiterpenes BIOGENIC EMISSIONS SV_ISO1, SV_ISO2 ∙OH isoprene EMISSIONS EMISSIONS EMISSIONS Pathways do not contribute to SOA O3,O3P, or NO3 Carlton et al. ES&T in press Non-volatile
PM2.5 Components (μg m-3) SO4 CMAQ v4.7 NO3 OC IMPROVE Observations (2002 – 2006) Organic PM – Moderate Success • Summer OC problem mitigated by: • Improving emissions input (wildfires, biogenic VOC) • Upgrading SOA treatment to match the state of the science (2008)
Motivating Questions – Revisited Has CMAQ performance for PM2.5 improved? Which refinements to the modeling system contributed most? 13
PM2.5 Components (μg m-3) SO4 CMAQ v4.7 NO3 OC IMPROVE Observations (2002 – 2006) Conclusions • Model performance has improved substantially! • I’ve reviewed 8 major refinements to the modeling system. • Meteorology inputs (2) • Emissions & deposition (4) • Atmospheric chemistry (2)