Download
1 / 29
310 likes | 565 Views
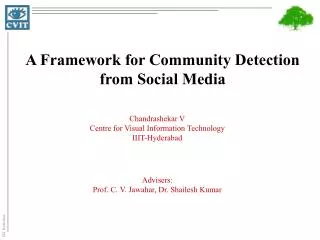
Community Detection with Edge Content in Social Media Networks . Paper presented by Konstantinos Giannakopoulos. Outline. Definitions Social Networks & Big Data Community Detection The framework of Matrix Factorization algorithms. Steps, Goals, Solution The PCA approach

E N D
Community Detection with Edge Content in Social Media Networks Paper presented by Konstantinos Giannakopoulos
Outline • Definitions • Social Networks & Big Data • Community Detection • The framework of Matrix Factorization algorithms. • Steps, Goals, Solution • The PCA approach • The EIMF algorithm • Description, Performance Metrics, Evaluation • Other Approaches • Algorithms, Models, Metrics
From Social Networks to Big Data Network Social Network BIG DATA
Social Networks • Users act (conversations, like, share) • Users are connected
Community Detection Density of Links Links and Content Some of the less strongly linked vertices may belong to the same community if they share similar content
General Methodology of MF models • Decomposition of a matrix into a product of matrices. • M: A matrix representation of the social network. M:[m x n] A:[m x k] B:[k x n] = • Product of two low-rank matrices • k-dimensional feature vector
What’s next? • Two sub-models: • Link matrix factorization FL • Content matrix factorization FC Each matrix contains a k- dimensional feature vector. F = min ||M − P ||2F + regulation term • P: Product of matrices that approximate M • Content is incorporated in FC using: • cosine similarity • norm Laplacian matrix. • Regulation term • improves robustness • Prevents overfitting.
Goal & Solution • Goal: To find an optimum representation of the latent vectors. Optimization problem. • Frobeniusnorm ||.||2F measures the discrepancy between matrices • When FLand FCare convex functions, minimization problem is solved using • conjugate gradient or quasi-Newton methods. • Then, FLand FCare incorporated into one objective function that is usually a convex function too. • Obtain high quality communities. • use of traditional classifiers like k-means, or SVMs
The PCA Algorithm • State-of-Art method for this model: • PCA (similar to LSI). Optimization problem: min||M−ZUT||2 + γ||U|| • Z: [n × l] matrix with each row being the l-dim feature vector of a node, • U: [l × n] matrix, and • ||.||2F : the Fobenius norm. Goal: Approximate M by Z UT, a product of two low-rank matrices, with a regulalizationon U.
Edge-Induced Matrix-Factorization (EIMF) • The partitioning of the edge set into k communities which are based both on their linkages and content. • Edges : latent vector space based on link structure. • Content is incorporated into edges, so that the latent vectors of the edges with similar content are clustered together. • Two Objective Functions • Linkage-based connectivity/density, captured by Ol • Content-based similarity among the messages, OC
Ol: link structure for any vertex and its incident edges • Approximate Link Matrix Γ: [m x n] Ol(E)=||ETV−Γ||2F or Ol(E)=||ETE∆−Γ||2F E:[k x m] V:[k x n]
Oc: link incorporating edge content • For each edge, the content is associated with it. • Each document is represented w/ a d-dim feature vector. • Cosine Similarity: Similarity measure of two corresponding feature vectors: • Normalized Laplacian matrix: To minimize the content-based objective function. Oc(E) = minEtr(ET ·L·E) C: [d x m]
To Sum Up • Two Objective Functions: • Linkage based connectivity/density. link structure for any vertex and its incident edges is: Ol(E) = ||ETV−Γ||2F • Content-based similarity among text documents. Oc(E) = minEtr(ET ·L·E) • Goal • Minimize the objective function O(E ) = Ol(E ) + λ · Oc(E ) • Solution • Convex functions => no local minimum => Gradient • Apply k-means for the detection of final communities
Experiments • Characteristics of the Datasets • Enron Email Dataset • #of messages: 200,399 • #of users: 158 • #of communities: 53 • Flickr Social Network Dataset • #of users: 4.703 • #of communities: 15 • #of images: 26,920
Performance Metrics • Supervised • Precision: • The fraction of retrieved docs that are relevant. • eg. high precision: Every result on first page to be relevant. • Recall: • The fraction of relevant docs that are retrieved. • eg. Retrieve all the relevant results. • Pairwise F-measure: • A higher value suggests that the clustering is of good quality.
Performance Metrics • Average Cluster Purity (ACP) • The average percentage of the dominant community in the different clusters.
Evaluation • Four sets of experiments with other algorithms • Link only • Newman • LDA-Link • Content • LDA-Word • NCUT-Content • Link + node content • LDA-Link-Word • NCUT-Link-Content • Link + edge content • EIMF-Lap • EIMF-LP • Tuning the balancing parameter λ
Strong/Weak points • Strong Points • Incorporation of content messages to link connectivity. • Detection of overlapping communities. • Weak Points • Tested mainly on email datasets (directed communication) and on dataset with tags. Not on a social network (broadcast communication). • Experiments do not see it as a unified model.
More Link-Based Algorithms • Modularity Measures the strength of division of a network into modules. High modularity => dense inner connections & sparse outer connections.
k1 = k2 = 1, k3 = k4 = k5 = 2, M = 2|E| = 8, Pij = (kikj) / (M)
Even More Link-based Algorithms • Betweenness Measures a node’s centrality in a network. It is the number of shortest paths from all vertices to all others that pass through that node. • Normalized Cut (Spectral Clustering) Using the eigenvalues of the similarity matrix of the data points to perform dimensionality reduction before clustering in fewer dimensions. It partitions points in two sets based on the eigenvector corresponding to the second-smallest eigenvalue of the normalized Laplacianmatrix of S where D is the diagonal matrix • Clique-based • PHITS
Other Algorithms • Node-Content • PLSA Probabilistic model. Data is observations that arise from a generative probabilistic process that includes hidden variables. Posterior inference to infer the hidden structure. • LDA Each content is a mixture of various topics. • SVM (on content and/or on links-content) A vector-based method that finds a decision boundary between two classes. • Combined Link Structure and Node-Content Analysis • NCUT-Link-Content • LDA-Link-Content
Other Community Detection Models • Discriminative • Given a value vector c that the model aims to predict, and a vector x that contains the values of the input features, the goal is tofind the conditional distribution p(c | x). • p(c | x) is described by a parametric model. • Usage of Maximum Likelihood Estimation technique for finding optimal values of the model parameters. • State-of-art approach: PLSI
Generative • Given some hidden parameters, it randomly generates data. The goal is to find the joint probability distribution p(x, c). • the conditional probability p(c|x) can be estimated through the joint distribution p(x, c). e.g. P (c, u, z, ω) =P(ω|u)P(u|z)P(z|c)P(c) • State-of-art approach: LDA
Bayesian Models • Estimate prior distributions for model parameters. (e.g. Dirichlet distribution with Gamma function, Beta distribution). • Estimate the Joint probability of the complete data. • A Bayesian inference framework is used to maximize the posterior probability. The problem is intractable, thus optimization is necessary. • Apply Gibbs sampling approach for parameter estimation, to compute the conditional probability. • Compute statistics with initial assignments. • For each iteration and for each node: • Estimate the objective function. • Sample the community assignment for node i according to the above distribution. • Update the statistics.
Additional Evaluation Metrics • Normalized Mutual Information NMI • The average percentage of the dominant community in different clusters. • Modularity • NCUT
Additional Evaluation Metrics • Perplexity • A metric for evaluating language models(topic models). • A higher value of perplexity implies a lesser model likelihood and hence lesser generative power of the model.
Comparative Analysis • Three models • MF, Discriminative (D), Generative (G) • Parameter Estimation • Objective Function min (MF) • Frobenius norm, Cosine similarity, Laplacian norm, quasi-Newton. • EM & MLE (D) • Gibbs Sampling (Entropy-based, Blocked) (G) • Metrics • PWF, ACP (MF) • NMI, PWF, Modu (D) • NMI, Modu, Perplexity, Runnning Time, #of iterations (G) m