Download
1 / 19
190 likes | 381 Views
Explore stochastic models, test against empirical data, ensure accuracy, suggesting improvements for stock market forecasting, financial derivatives, investment management. Article focuses on Brownian Motion, Geometric Brownian Motion, modeling stock prices using drift and volatility factors. Detailed procedures for implementing models, inputs, simulations with historical data comparison, accuracy tests, and analysis. Includes pros and cons of stochastic models and potential future developments in asset price modeling.

E N D
Preetam D’Souza Applications of Stochastic Processes in Asset Price Modeling
Introduction • Stock market forecasting • Investment management • Financial Derivatives • Options • Mathematical modeling
Purpose Examine different stochastic (random) models Test models against empirical data Ascertain accuracy and validity Suggest potential improvements
Hypothesis Stochastic methods will be close to accurate Average several runs Calibrate models
Background Mathematically-oriented articles Theoretical nature Few examples of numerical evidence
Stochastic Processes? Random or pseudorandom in nature Future based on probability distributions Sequence of random variables
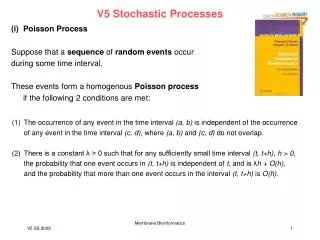
Brownian Motion • Follows Markov chain • Based on random walk • Wiener Process (Wt) • Continuous time • Draws values from normal distribution
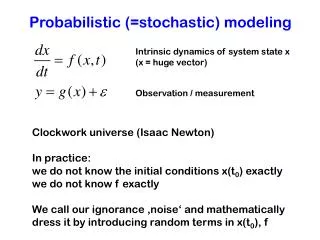
Brownian Motion SDE dSt = µdt + σdWt St : stock price µ : drift (mean) σ : volatility (variance) Assumes stock price follows stochastic process Notice any problems? Stock price may go negative
Geometric Brownian Motion (GBM) dSt = µStdt + σStdWt No more negative values Assumes that stock price returns follow stochastic process
Procedure Implement Brownian motion models in Java 3 Inputs to Model Drift Volatility Time steps Run models for 1 year Compare with empirical data
Testing Blue chip: IBM Historical data freely available Yahoo ! Finance Compare simulated run with historical data Accuracy tests Root Mean Squared Deviation
Simulated Run • IBM simulated run given initial price in January 2000 • One year • 255 trading days • Drift = 5% (risk-free rate) • Volatility = 0.2
Simulated Run (contd.) • IBM simulation with 3 simultaneous runs • Compare with empirical data (red, solid line) • Ending prices are very close • Note that this run is for January 1990-1991
What about predicting the future? • IBM simulation for bear session for January 1991-1992 • Note how the drift rate is still positive • All runs deviate from mean line and follow empirical price • Ending prices are within $10 of closing price
Accuracy? • RMSD test • Larger values indicate an inaccurate run • Smaller values indicate a simulation that is generally close to the empirical price at all time steps • RMSD = 22.735 vs. 9.457 for the run on the previous page
Analysis & Conclusions Stochastic models generate price fluctuations very similar to actual data Uncertainty increases as time steps progress Further calibrations must be made to fine tune models
Pros of Stochastic Models Inputs for stochastic models can readily be gathered from empirical data GBM model seems to fit stock price data well The model incorporates increased risk as time increases The GBM model is capable of producing results that are within $10 of a stock’s ending price after one year
Cons of Stochastic Models There is NO guarantee that each individual run will converge to the empirical ending price The GBM model seems to perform badly during bear markets because it is centered around the drift line and thus overestimates growth There is no incorporation of current events data that may heavily impact a stock’s price, such as earnings reports, executive changes, etc.
Further development • Correlation statistics • Comprehensive simulation runs • Model calibration • Assume lognormal distribution • Different stochastic models • Jump Diffusion