Download
1 / 19
190 likes | 350 Views
Waste Water Related Environmental Reporting in Hungary – Ensuring consistency – Hungarian Central Statistical Office Environment Statistics Department by Pál AUJESZKY. Mult-Beneficiary Statistics Programme PHARE 2001 Pilot Project on Environmental Statistics Second Project Workshop

E N D
Waste Water Related Environmental Reporting in Hungary – Ensuring consistency – Hungarian Central Statistical Office Environment Statistics Department by Pál AUJESZKY Mult-Beneficiary Statistics Programme PHARE 2001 Pilot Project on Environmental Statistics Second Project Workshop (Budapest, Hungary 22-23 April 2004) www.ksh.hu
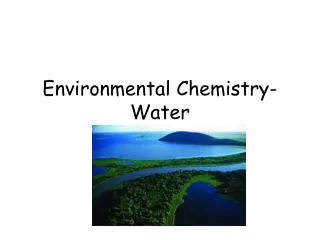
Hydrological Background • Hungary is situated in the Charpatian basin, and the 96% of our surface water comes from the upstream countries, • In Hungary the role of ground waters is very important, • 66% of the groundwater is vulnerable against the pollution from the surface.
The waste water treatment statistics in Hungary • In Hungary there is a gap between the waste water collection and water supply, • and there is also a big gap between the waste water collection and waste water treatment. • dwellings connected to the public water conduit network is more than 92%, and the ratio of dwellings connected to the public sewerage is about 53%. • The total volume of waste water connected to public sewerage is about 500 million m3/year and the volume of biologically or with advanced treatment technology treated waste water is about only 300 million m3/year at municipal waste water treatment
The waste water treatment statistics is divided between HCSO and the Ministry of Environment and Water and their regional offices or authorities. • The yearly report of the Hungarian Central Statistical Office on the water supply, waste water collection and waste water treatment of settlements, was revised in 2002 and 2003 to fulfil the EU/OECD requirements.
HCSO data collection: • Quantitative and qualitative data on discharged municipal waste water • completed with a metadatabse • available on the web side (www.ksh.hu) • Oracle 8 and Oracle Express • This data collection covers the following branches of the original waste water treatment loading scheme according to the JQ 2002.
Statistical questionnaires of Ministry of Environment and Water : • 1364 Report on pollution of surface water • 1365 Report on pollution of public sewerage • 1376 Report on the technical data of the public water works and waste water plants • 1378 Report on the water use of industries (but there is a threshold: water use is more than 5 m3/h and 80m3/day)
– Remarks to the reports of MoEW 1. • These questionnaires are not a full-scope questionnaires • main purpose is not to fulfil the statistical aims and requirements • there is not a standard grossing-up methods to calculate a real national data • the non-response problem is also untreated • data suppliers are where the environmental inspectorate take a measure • self-control by accredited laboratories (2005) • OECD and Eurostat Joint Questionnaires are not based an EU Regulation directly
– Remarks to the reports of MoEW 2. • the measurement is very expensive (e.g. BOD5) • measurements of heavy-metals are also very expensive
Hungarian National Waste Water Collecting and Waste Water Treatment Plan • According to UWWTD and the joint 93/481 Council Decision, • Derogation on the Environment Chapter • This plan will be regularly updated • There is also a WWT National Program for the other areas or settlements
The time schedule of this plan • 31 December 2008 Aggl. > 10 000 PE and sensitive areas biological treatment with N and P removal • 31 December 2010 Aggl. > 15 000 PE with min. biological treatment • 31 December 2015 10 000 PE < Aggl. < 15 000 PE min. biological treatment • 31 December 2015 2000 PE < Aggl. < 10 000 PE biological treatment
We are using the UWWTD definitions for determination of treatment type, and for the PE (60g BOD5/day).
We are harmonising also with the WFD. • a remediation program for polluted areas, • a program against N from agriculture, • protection and monitoring of vulnerable water basins, • monitoring the full cost recovery price • water director, • a program for healthy drinking water
To fulfil EU requirements, we try to solve the problems: We try to elaborate: • estimation methods for non-measured values by emission factors, • concrete statistical sampling methods for waste water discharges, • we try to established a Task Force from experts (MoEW, consultants, HCSO), • we intend to translate, and apply the Eurostat Water Statistics Manual,
Hungarian Waste Water Statistics Handbook jointly to the HCSO report, by the Service Contract of ICON. • started in February 2004 • This Hungarian Handbook will help our statisticians at our territorial directorates to become a real partner for the data supplier in filling out the questionnaire.
The Hungarian WWT Handbook will contain the following topics • a FAQ part to solve the frequent problems, (First Aid part) • basic knowledge on WW collecting and WW treatment • legal background (International and national) • definitions, • solutions for non-response, imputations, • use of emission factors, • explanation of new concepts for the regional statistician (BOD, PE, WWT agglomeration) • control lists for informatics • special short case studies • appendices (e.g. list of agglomeration) • bibliography etc.
The general conclusion • The good questionnaire is not enough, • the real problem come after the sending out of questionnaires, • a methodological handbook is necessary.