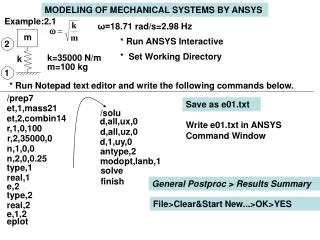
Download
1 / 7
70 likes | 197 Views
This article explores the dynamic response of MEMS shunt switches as modeled by the d'Alembert principle. Key parameters such as switching time, mechanical bandwidth, thermal noise, resonant frequency, and quality factor are examined. The impacts of damping resistance and tailored actuation voltage on switching performance are analyzed through equations demonstrating energy consumption and response characteristics. Insights into current distribution, inductance, capacitance, and loss in MEMS designs are also provided, enhancing understanding of high-frequency behaviors in microelectromechanical systems.

E N D
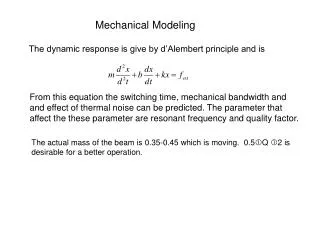
Mechanical Modeling The dynamic response is give by d’Alembert principle and is From this equation the switching time, mechanical bandwidth and and effect of thermal noise can be predicted. The parameter that affect the these parameter are resonant frequency and quality factor. The actual mass of the beam is 0.35-0.45 which is moving. 0.5Q 2 is desirable for a better operation.
Gas fundamental and Quality factor The mean free path , Kundsen number K and viscosity is given by A low kundsen number means that there are many collusion and the gas is viscous (liquid). The damping and Quality factor is given by So from the equation above it is evident that by slot (p) and low pressure low damping increase the Quality factor. Damping also change with height.
Switching Time The switching time can be calculate form eq. 3.16 and with little damping and with damping the switching time is given by. The release time can be calculated using nonlinear dynamic equation from the restoring force with actuation force keeping zero. The velocity, acceleration and Current of the beam during switching is shown in the figure 3.7,3.8,3.9. The fringing capacitance is given by equation 3.27 and force 3.28 and it is seen duo to fringing capacitance the switching time reduces. Effect of damping resistance and Taylored Actuation voltage (consult with Trond)
Switching energy, Responses to waveform and self actuation The energy consumed in switching process is sum of electrical and mechanical energy of the beam and given by eq 3.29, 3.30. For a typical switch the switching energy is around 5 nJ. The response to single wave form is shown in fig 3.13 and the double or multiple wave form is shown in fig 3.14 . Also the amplitude and Frequency modulated signal response is shown. For high power the dynamic analysis also show the same trend as static and self actuate the beam and collapse to down position for high power. The intermodulation product power is given by eq 3.44 and increase with Cup as the product depends on the upstate capacitance. So inter modulation product are much larger in varactors than switch. It also depends on K and g0. The brownian noise mainly come from damping so a high Q switch has less noise. Fn=sqrt(4bkT), It also depends on K.
Electromagnetic Modeling A MEMS shunt switch can be modeled RLC series resonator in shunt connection to Transmission line shown in fig 4.1. The switch shunt impedance and LC series resonant frequency given by The Up-state capacitance with fringing field is given in Table 4.1. The Rule of thumb is that the hole diameter should be less that 3g, not to affect the up-state parallel plate capacitors. The down state capacitance is degraded if the MEMS bridge layer and dielectric layer is rough. It can be used high-dielectric to increase the downstate capacitance.
Current distribution, Resistance, Inductance and Loss The Current distribution is shown in figure 4.3 and it is seen that the current is concentrated on the edge of the transmission line and also at the edge of beam, i.e. skin effect. Series resistance is combination of Rs1 duo to t-line loss and Rs due to MEMS bridge only. For thin beam the bridge resistance is constant. Inductance: The inductance can be modeled from down state position it’s mainly depends on the gap in CPW line and is higher for low spring constant beam due to mender. Loss: The loss is given by eq 4.9 and 4.10 and the switch loss is given by eq 4.14 and 4.15 for both up and down position.
Fitting CLR parameter The upstate capacitance can be found from S parameter and eq. 4.16 and 4.17. Down state capacitance and inductance: Below resonant frequency and s parameter and eq. 4.19 the downstate capacitance can be measured, and from resonant frequency the inductance can be measured which is dominant after f0. Series resistance: The series resistance is best fitted around LC resonant frequency and given by eq 4.20. For upstate resistance a no of switch has to be series connected and using eq. 4.14