Constructing a Stem-and-Leaf Plot for Cardiogram Data Analysis
This guide outlines the process of constructing a stem-and-leaf plot using daily cardiogram data collected over 20 days at an outpatient testing center. The steps include organizing the data in ascending order, separating the leading and trailing digits, and displaying them in a structured format. A separate example is provided for analyzing a test score distribution among students in a class. This method is a valuable tool for visualizing data and understanding its distribution in a concise manner.


Constructing a Stem-and-Leaf Plot for Cardiogram Data Analysis
E N D
Presentation Transcript
3 Steps to Constructing A Stem and Leaf Plot
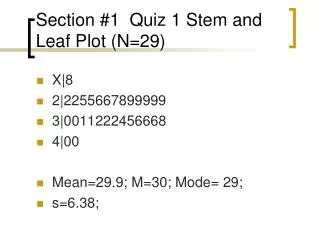
At an outpatient testing center, the number of cardiograms performed each day for 20 days is shown. 25 31 20 32 13 14 43 02 57 23 36 32 33 32 44 32 52 44 51 45
Constructing a Stem & Leaf Plot Step 1 Arrange the data in order and separate according to the first digit 02 20, 23, 25 13, 14 31, 32, 32, 32, 32, 33, 36, 43, 44, 44, 45, 51, 52, 57
Constructing a Stem & Leaf Plot Step 2 Separate data putting the leading digit in the left column and all of the trailing digits in their corresponding rows Leading digit (stem) Trailing Digit (leaf) 0 1 2 3 4 5 2 3 4 0 3 5 1 2 2 2 2 3 6 3 4 4 5 1 2 7
Constructing a Stem & Leaf Plot Step 3 Divide the leading digit and trailing digit by a vertical line 0 1 2 3 4 5 2 3 4 0 3 5 1 2 2 2 2 3 6 3 4 4 5 1 2 7 ____________________
A particular class of 18 students took a test and the grades were: Try one on your own: 75 82 92 88 64 81 61 84 77 97 66 73 88 89 79 88 77 69
A particular class of 18 students took a test and the grades were: 1 4 6 9 3 5 7 7 9 1 2 4 8 8 8 9 2 7 6 7 8 9 ____________________