Download
1 / 32
320 likes | 475 Views
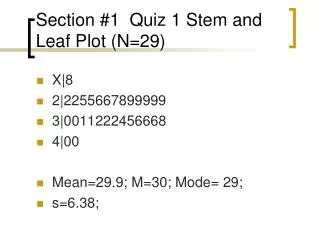
Section #1 Quiz 1 Stem and Leaf Plot (N=29). X|8 2|2255667899999 3|0011222456668 4|00 Mean=29.9; M=30; Mode= 29; s=6.38;. Section #2 Quiz 1 Stem and Leaf Plot (N=36). X| 7 1|147889 2|244689 3|11122223333444567799 4|002 Mean=29.36; M=32; Mode= 32, 33; s=8.68;.

E N D
Section #1 Quiz 1 Stem and Leaf Plot (N=29) • X|8 • 2|2255667899999 • 3|0011222456668 • 4|00 • Mean=29.9; M=30; Mode= 29; • s=6.38;
Section #2 Quiz 1 Stem and Leaf Plot (N=36) • X| 7 • 1|147889 • 2|244689 • 3|11122223333444567799 • 4|002 • Mean=29.36; M=32; Mode= 32, 33; s=8.68;
Part IISigma Freud & Descriptive Statistics Chapter 5 Ice Cream and Crime: Computing Correlation Coefficients
What you will learn in Chapter 5 • What correlations are and how they work • All about correlations... • How to compute them • How to interpret them • Other types of correlations that exist
What they are not • Correlations only tell us about the relationship and the strength of the relationship. • Correlations do NOT tell us about cause and effect.
What they are not • Correlations do not imply causation • Examples • Marijuana use and heroin • Milk use and cancer • Church attendance and drug use • Lead levels and behavior • Cigarette smoking and Alzheimer’s • Education and sexual activity • Sex life and longevity • Coffee and suicide risk
What Correlations are about… • Examines the relationship between variables • How the value of one variable changes in relation to changes in another variable • Range between -1 and 1 • Bivariate correlation (2 variables) • Pearson product-moment correlation • Karl Pearson
Types of Correlation Coefficients • Positive Correlation • Direction Correlation • When variables change in the same direction • Negative Correlation • Indirect Correlation • When variables change in opposite directions rXY = correlation between X and Y
Things to Remember • Correlations… • Range in value from -1 to +1 • Absolute value indicates strength • Reflect situation where there are at least two data points • May want to use “indirect” and “direct” instead of “positive” and “negative” to keep from assigning value to the relationship
Computing Simple Correlations • Pearson product-moment… • What do these symbols represent?
Steps in Computation • List the two values for each participant • Compute the sum of X values, and compute the sum of Y values • Find square of sum for x and y • Find sum of squares for x and y • Find the sum of the XY products • Now “plug” these values into the formula
Pearson’s product-momentSteps in the process • Step 1: • Calculate • Σx • Σx2 • (Σx)2 • Σy • Σy2 • (Σy)2
Pearson’s product-momentSteps in the process • Step 2: • Calculate Σxy • Sometimes referred to as the sum of the cross-products • Step 3: • Substitute the values derived above into the formula • Note that N = number of pairs of scores
The Visual Picture • Scatterplot
Is Rate My Professor Valid? • The Rate My Professor system relies on students who are willing to rate their professors anonymously. While this could encourage more candid feedback, the anonymous system has also at times provided what could be inaccurate ratings.
Is Rate My Professor Valid? • One study showed the easier a class was and the more attractive the teacher, the more likely they would get a good rating on Rate My Professor. Others have expressed worry that Rate My Professor listings often give good ratings to teachers that may not provide the most comprehensive, educational, or quality courses available.
Computing Simple Correlations • Pearson product-moment… • What do these symbols represent?
Variance Explained • Coefficient of Determination • rxy = .70 • .702 = .49 or 49% • Coefficient of Alienation • rxy = .70 • .702 = .49 • 1.00 - .49 = .51 or 51%
How Variables Share Variance • Remember: Association NOT Causation
Using the Computer • Computing Correlation Coefficients using SPSS
SPSS Scatterplot • Selecting Variables
SPSS Scatterplot • Entering variables
SPSS Scatterplot • Simple Scatterplot
Glossary Terms to Know • Pearson-product moment correlation • Direct correlation • Positive correlation • Indirect correlation • Negative correlation • Scatterplot