Download
1 / 36
360 likes | 479 Views
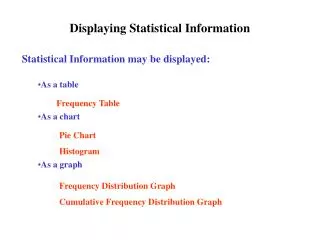
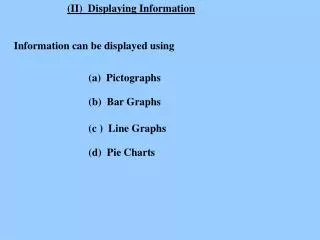
This presentation highlights the use of online platforms for accessing and visualizing water quality information collected by the USGS NAWQA. It covers essential features like data summaries, retrieval methods, and mapping options. The system includes over 14 million data values from thousands of surface water sites and wells, nutrient and contaminant samples, and biological community data. Attendees will learn how to effectively use the website for research, explore GIS mapping capabilities, and compare results against national and regional backgrounds.

E N D
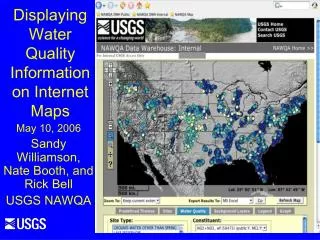
Displaying Water Quality Information on Internet Maps May 10, 2006 Sandy Williamson, Nate Booth, and Rick Bell USGS NAWQA
Talk Outline • How you could use our website/data • NAWQA Data Summary • How to retrieve Data • Mapping options before or after data retrievals
How you could use our website/data • Consistent National/Regional Data for Research • Comparison of your results to National/Regional Background • GIS / Exploratory data analysis / Mapping • Examples and Ideas for your website
Google: water quality data Usage: About 2400 sessions per month #4
NAWQA Data Summary • 7,600 surface water sites and 8,100 wells • 48,000 nutrient samples; 30,000 pesticide samples and 8,800 VOC samples • 2,600 sediment and tissue contaminant samples • About 2,000 samples each of Fish, Invert and Algae community counts. • Daily stream flow and Ground water levels • Totaling 14+ million data values
NAWQA Public DW water.usgs.gov/nawqa/data #6
Nitr% Following slides show “data values” #10
Search options Bottom of window Top of window #12
Surface Water / Bed Sediment,Results Columns omitted for powerpoint display – Can Export Delimited or Excel #13
Mapping Sites - San Joaquin Study Unit All Sites • On Shaded Relief
Pick SJ Study Unit Surface- Water sites • On Topo Maps
Atrazine in US (ag sites) • Atrazine in Surface Water • Over Land Use Map #19
Denver MTBE close zoom WELL #22
Caffeine in DC Area w- hi-res Stream Gage #23
100+ Background Layers http://nationalmap.gov/ #25
Export All Date in Current map view to: • Excel • Tab Delimited • Google Earth
NAWQA Google Earth Viewer USGS NAWQA Sites
DW Team Please Stand • Nate Booth,WI - Technical Leader • Jessica Thompson, WI Aggregation / Discoverer • John Hollis, WI Java/Mapping • Eric Everman, MN Java/Mapping • Rick Bell, AR – Training, Testing and Support • Pete Ruhl, Reston and Mitch Harris, Il– BioTDB • Ken Skach, OR –Data checking/ contact with SU’s water.usgs.gov/nawqa/data #32
Displaying Water Quality Information on Internet Maps NWQMC San Jose May 10, 2006 Sandy Williamson Nate Booth, and Rick Bell USGS NAWQA Sandy’s Office