Download
1 / 25
250 likes | 461 Views
MODIS Atmospheric Profiles Suzanne Wetzel Seemann, CIMSS MOD07 Developer. Retrievals are performed in 5x5 FOV (approximately 5km resolution) clear-sky radiances over land and ocean for both day and night.

E N D
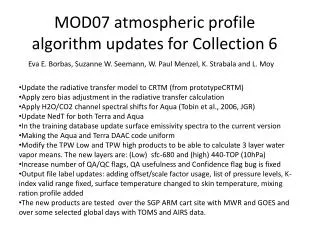
MODIS Atmospheric ProfilesSuzanne Wetzel Seemann, CIMSSMOD07 Developer • Retrievals are performed in 5x5 FOV (approximately 5km resolution) clear-sky radiances over land and ocean for both day and night. • Algorithm is a statistical regression and has the option for a subsequent nonlinear physical retrieval. • Regression predictors include MODIS infrared radiances from bands 25, 27-36 (4.4 - 14.2mm). • Clear sky determined by MODIS cloud mask (MOD35).
MODIS MODIS IR Bands Spectral Position
MODIS IR Bands Profile Sensitivity - Temperature
MODIS IR Bands Profile Sensitivity – Water Vapor
Atmospheric Profile Output • Atmospheric precipitable water vapor (total, high -250 hPa to 700 hPa, and low- 920 hPa to the surface) • Profiles of temperature and moisture (20 levels) • Total column ozone • Stability indices (lifted index, total totals) • Surface Skin Temperature
RTE (no scattering) in LTE R=sBs(Ts) s(ps) - 0psB(T(p)) d(p) + rs (ps) 0psB(T(p)) d*(p) + Rsun 1+sec(ps) rs sun R…radiance, …wavenumber, s…surface, p…pressure, sun…solar, T…temperature, B…Planck function, …emissivity,r…reflectivity, …level to space transmittance, ...local solar zenith angle *…level to surface transmittance [*= (ps)/ (p)] Algorithm Discussion
Algorithm Discussion - continue R is measured by MODIS for = 4.4 - 14.2mm (R25, R27, … R36) R can be considered a nonlinear function of the atmospheric properties including T, q, ozone, surface pressure, skin temperature, and emissivity. We can infer a statistical regression relationship using calculated radiances from a global set of radiosonde profiles and surface data. Relationship is inverted to retrieve atmospheric properties from observed MODIS radiances.
Algorithm Discussion - continue • Global radiosondes: data set drawn from NOAA-88, TIGR-3, ozonesondes, ECMWF analyses, desert radiosondes containing 15000+ global radiosonde profiles of temperature, moisture, and ozone used for training data set. • RT model: Radiance calculations for each training profile are made using a 101 pressure layer transmittance model. MODIS instrument noise is added to calculated spectral band radiances. • Radiosonde temperature-moisture-ozone profile / calculated MODIS radiance pairs are used to create the statistical regression relationship. • Bias corrections are applied to the observed MODIS radiances to account for forward model error, spectral response uncertainty, and calibration error.
MODIS Land – Sea Classified Retrievals • New BT zones: OLD BT 11mm ZONES Zone 1: < 245 K Zone 2: 245-269 K Zone 3: 269-285 K Zone 4: 285-294 K Zone 5: 294-300 K Zone 6: 300-310 K Zone 7: > 310 K Land Zone 1: < 272, 1978 profiles (< 275) Zone 2: 272-287, 2538 profiles (269-290) Zone 3: 287-296, 2807 profiles (284- 299) Zone 4: 296-350, 2226 profiles (293-353) Ocean Zone 1: < 283.5, 2214 profiles (< 286.5) Zone 2: 283.5-293, 2900 profiles (280.5-296) Zone 3: 293-350, 2437 profiles (290-353)
Single FOV Eigenvector Regression Retrieval of T, q, Ts, TPW, O3, and s under clear conditions • Preparation of representative trainingsets • Forward Model Calculations using SARTA • Application of BT/scanang-classification scheme • Retrieval Validation/Comparison: ECMWF analysis, global RAOBs, MODIS and GOES Retrievals, L2 Standard Product • TIGR3 & Noaa88 & ECMWF & special desert and polar cases • Ecosystem assigned to each point to get realistic surface pressure, surface skin temperature and surface emissivity. X= C YT Regression Model Least squares regression solution Class BT@1000 cm-1 training BT@1000 cm-1 observations C = X Y (YT Y) -1 X…Atmospheric State, C…Coefficients, Y…Measurements 1 BT 260 BT 255 2 250BT270 255BT265 3 260BT280 265BT275 4 270BT290 275BT285 5 280BT300 285BT295 6 290 BT 295 BT 11 scanning angles with sec()=1 + *i i=0,1,2,…10 and =0.0524 AIRS Clear-Sky Regression Retrieval
PW High 700-300 hPa PW (mm): 0 3 6 9 12 15 18 PW Low 920 hPa - sfc
Global Total Ozone (Dobson) for December 1, 2004 MODIS MOD07 TOMS
TPW (mm): 0 6 12 18 24 30 36 42 48 54 60 66 72 Global Total Precipitable Water Comparison 22 May 2002 MODIS TPW SSM/I f-14 TPW Ascending and descending passes were averaged
MODIS Physical Retrieval TPW (mm) for 2 June 2001 over North America MODIS Statistical Retrieval GOES-8 and GOES-10 Day Night
240 260 280 300 320 340 360 380 400 420 440 TOMS (dob) 240 260 280 300 320 340 360 380 400 420 440 MODIS (dob) % Error (M-T)/T - 40 - 20 0 20 40 60 80 - 60 - 40 - 20 0 20 40 60 80 Latitude (o) Total Ozone from MODIS (top) and TOMS (bottom) May 22, 2002 Mean difference MODIS - TOMS = 4.4 dob RMS = 27.4 dob mean abs % error: abs(M-T)/T = 5.9% N = 10,614
MODIS GDAS Sonde Pressure (hPa) Pressure (hPa) Temperature Mixing Ratio Temperature Mixing Ratio Pressure (hPa) Pressure (hPa) Temperature Mixing Ratio Temperature Mixing Ratio MODIS profiles agree well with radiosondes and NCEP-GDAS when the atmospheric temperature and moisture is fairly smooth and monotonic: But not so well with smaller-scale features, such as isolated dry or moist layers:
Pressure (hPa) oK Temperature Isobaric Surfaces/Profiles of Temperature 13 October 2002 Terra MODIS direct broadcast 300 hPa 500 hPa 850 hPa
Pressure (hPa) Mixing Ratio (g/kg) Isobaric Surfaces/Profiles of Moisture 13 October 2002 Terra MODIS direct broadcast 300 hPa 500 hPa 850 hPa
AIRS Profile – Valparaiso, Fl – 15 Oct 2003 good portrayal of dry layer on top of low level moisture AIRS assesses changes in stability AIRS 1845 UTC VPS 1800 UTC Earth Science Enterprise EOS Products National Aeronautics and Space Administration MODIS land surface temperatures are used in forecasting morning low temperatures and in IFPS validation. AIRS profiles will map temperature and moisture gradients and help diagnose asynoptic changes in atmospheric stability.
Fredericktown F2 - 800yds 9 mi 3:45-4:00p Smoke from Montana forest fires – summer 2003 High concentrations of aerosols Van Buren F4 - 300yds 21 mi 3:13-3:45p Hendrickson F4 - 650yds 21 mi 3:45-4:18p Earth Science Enterprise EOS Products National Aeronautics and Space Administration Color composite imagery and aerosol optical depth derived from MODIS can identify regions of restricted visibility with significant impact on aviation . MODIS 250m visible and color composite imagery can detect tornado damage tracks and help in storm intensity assessment. MODIS Aerosol Optical Depth
Some aspects of AIRS Sounding Retrieval and their impact on IMAPP Products Dr Pradeep Kumar Thapliyal, ASD/MOG/RESIPA Space Applications Centre (ISRO), INDIA ABSTRACT As a part of International MODIS/AIRS Processing Package (IMAPP) an algorithm has been developed at Cooperative Institute for Meteorological Satellite Studies (CIMSS) to retrieve atmospheric and surface parameters from AIRS-L1B radiance measurements. In this presentation some aspects of the AIRS sounding retrieval, based on principal component regression (PCR), will be discussed. Presentation will mainly focus on retrieval sensitivity to infrared (IR) spectral surface emissivity, training data classification (global versus regional), sunglint/solar-reflection effect, etc. Some interesting features in AIRS observed radiance spectra that might help in detecting boundary-layer temperature inversion, will also be presented.