Download
1 / 4
40 likes | 165 Views
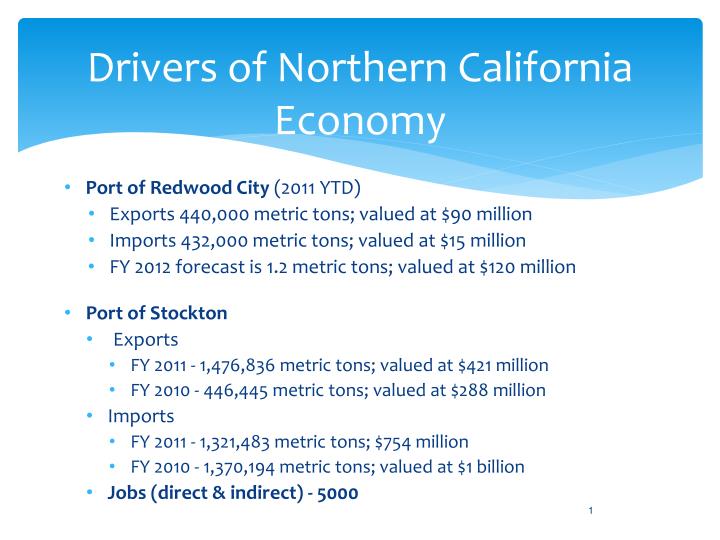
Drivers of Northern California Economy. Port of Redwood City (2011 YTD) Exports 440,000 metric tons; valued at $90 million Imports 432,000 metric tons; valued at $15 million FY 2012 forecast is 1.2 metric tons; valued at $120 million Port of Stockton Exports

E N D
Drivers of Northern California Economy • Port of Redwood City (2011 YTD) • Exports 440,000 metric tons; valued at $90 million • Imports 432,000 metric tons; valued at $15 million • FY 2012 forecast is 1.2 metric tons; valued at $120 million • Port of Stockton • Exports • FY 2011 - 1,476,836 metric tons; valued at $421 million • FY 2010 - 446,445 metric tons; valued at $288 million • Imports • FY 2011 - 1,321,483 metric tons; $754 million • FY 2010 - 1,370,194 metric tons; valued at $1 billion • Jobs (direct & indirect) - 5000
Drivers of Northern California Economy • Port of Oakland (FY 2010) • Inbound: 802,913 Twenty-foot equivalent Unit (TEU) • Outbound: 954,814 TEU • Imports valued at $24.3 billion • Exports valued at $15.4 billion • Economic Impacts to the region: • Jobs – 28,800 • Labor income (earnings) - $2.2 billion • Local and state tax revenues - $ 233 million
Drivers of Northern California Economy • Port of San Francisco (FY 2011) • Exports 23,234 metric tons; $52,103 • Imports 1,054,401 metric tons; $578,387 • Cruise ship passengers 136,000; revenue generated - $1.7 million • Port of Richmond (FY 2010) • Exports 122,650 metric tons • Imports 83,644 metric tons • Port of Benicia (2011 YTD) • Exports 77,148 metric tons; valued at $6.2 million • Imports 108,134 metric tons; valued at $1.8 billion • Port of West Sacramento (July 1, 2010-June 30, 2011) • Exports 257,200 metric tons; valued at $115,740,200 • Imports 334,100 metric tons; valued at $47,741,960
Drivers of Northern California Economy • Oil Refineries • SF Bay Area home to 42% of the refining capacity in California • Chevron - 240,000 barrels per day • Tesoro - 166,000 barrels per day • Shell - 155,000 barrels per day • Valero - 144,000 barrels per day • ConocoPhillips - 120,000 barrels per day • Economic Impacts in Contra Costa and Solano Counties: • Jobs – 76,238 • Labor income (earnings) - $7.7 billion • Local, state and federal tax revenues - $1.1 billion