Download

1 / 14
140 likes | 294 Views
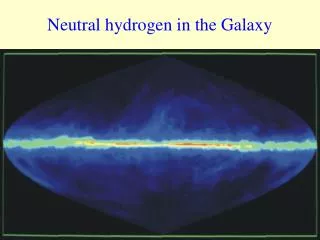
Statistical Analysis of Redshifted Neutral Hydrogen. Sanjay K. Pandey L.B.S.P.G.College, Gonda (India). Basic Problem:. “To quantify neutral hydrogen distribution using visibility based techniques.”.

E N D
Statistical Analysis of Redshifted Neutral Hydrogen Sanjay K. Pandey L.B.S.P.G.College, Gonda (India).
Basic Problem: “To quantify neutral hydrogen distribution using visibility based techniques.”
“To quantify statistical properties of visibilities measured at different baselines and frequencies and their relation to statistical properties of HI distribution.”
Visibility: Direction to the source d T2 T1 Intensity distribution Primary beam pattern
Visibility correlations: Two visibility correlation function (S2) probes thepower spectrum of HI density fluctuation,whereas three visibility correlation function (S3) probes thebispectrumof HI density fluctuation at the redshift where the radiation originated. Power spectrum and bispectrum both are real quantities. While power spectrum is necessarily positive, bispectrum need not to do so. S3 (or bispectrum) is the lowest order statistics sensitive to non-Gaussian features.
HI Fluctuations: We suppose HI fluctuations homogenous and isotropic. Homoginity S3= 0 S3 is non-zero Isotropy implies that only shape and size of the triangles are important not their orientation (in the plane of the sky) • we considcer only those combinations of baselines for which they form a closed triangle.
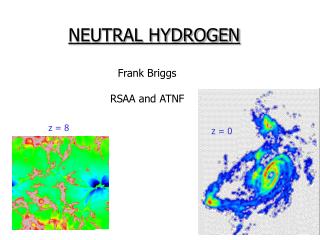
Problem Restated: Using analytical form of Bispectrum, we estimate the magnitude and the nature of the HI signal. We investigate the feasibility of using such observations to probe the structure formation at high redshifts ( in particular post reionization epoch). We have used GMRT parameters but scaling the results for other telescope could be done.
Frequency dependence of S3: Correlations decay rapidly as frequency separation is increased. For a given central frequency the signal is large for small baselines.
U dependence of Ratio of S3 and S2 Magnitude S3 and S2 are comparable . The signal corresponding to S3 falls faster than that for S2 with increasing U. Because bispectrum is quadratic in power spectrum whereby it grows faster with time.
Dependence of S3 on shape of triangles and bias parameters: There is shape dependence for larger baselines U > 1000. S3 decreases faster for equilateral triangle than for bilateral. The ratio has distinct dependence on bias parameter. The shape dependence of S3 can be used to determine bias parameters
Issues still to be resolved: Errors in the estimates are to be evaluated. Extraction of HI signal from various contaminants which are dominants at low frequencies. Contribution from continuum sources is expected to be correlated at large frequency differences. HI signal becomes uncorrelated beyond 1.3 MHz. System noise. For GMRT 200 – 1000 hrs of observations are needed to detect the HI signal. Man made interference: cell phone etc. Difficult to remove ?