Download
1 / 39
390 likes | 497 Views
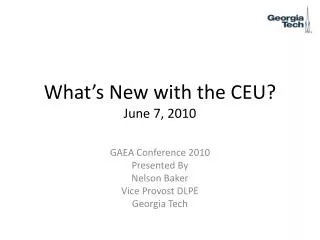
What’s New with the CEU? June 7, 2010. GAEA Conference 2010 Presented By Nelson Baker Vice Provost DLPE Georgia Tech. Outline. CE Context CE Policy Challenges/Opportunities. Context Themes. Desire for Flexible Education System (not lower quality, flexibility with interaction)

E N D
What’s New with the CEU?June 7, 2010 GAEA Conference 2010 Presented By Nelson Baker Vice Provost DLPE Georgia Tech
Outline • CE Context • CE Policy • Challenges/Opportunities
Context Themes • Desire for Flexible Education System (not lower quality, flexibility with interaction) • Aging Workforce • US Lowering Educational Attainment • Economic / New Economy • Globalization
Learning Flexibility • 2009 Sloan consortium Survey of Online Learning • Fall 2009 study • ~4.4M students enrolled in online courses during • 25% of all college and university students • Our students want information in new ways and in new formats/frameworks • Employers want education/training in flexible manner too • Our faculty make learning happen
Business of Education • Meeting student demands - flexibility • Non-credit students & their employers represent potential for significant impact – they have buying power for economic growth in the state and tax revenue through their salary and company activity • Number of Students impacted • Credit: 282,978 (2008; USG website) • Non-credit: 338,895 (USG CE website) • Point: CE impacts 1 in 2 individuals and represent Georgia citizens and taxpayers
Labor Force Composition (percentage)Aging Workforce Median Age • 35.4 • 1996 38.3 • 2006 40.8 • 2016 42.1 Source: Monthly Labor Review, November 2007
Aging Workforce • Improve talent utilization throughout every employee’s tenure with their companies, through a continuous improvement-style approach that involves periodic skill and career interest assessments, training, and alignment of the individual’s interest and attitudes • Plan and forecast future retirement talent deficits and forecast talent needs for potential business changes • During mid-career, rebalance knowledge/skills to match needs/interests of employer and employee – role for CE The New Agenda for an Older Workforce, A Manpower White Paper, 2007
Educational Attainment by Age Age HS Some BS Adv 25 to 29 years . . . . . . 83.6% 58.3% 27.2% 5.9% 30 to 34 years . . . . . . 84.2% 57.9% 27.9% 8.4% 35 to 39 years . . . . . . 84.7% 56.5% 25.9% 8.4% 40 to 44 years . . . . . . 85.4% 56.7% 25.9% 9.1% 45 to 49 years . . . . . . 86.4%59.5% 28.5% 11.3% 50 to 54 years . . . . . . 85.4% 58.5%29.1%12.7% 55 to 59 years . . . . . . 81.1% 50.6% 24.6% 11.5% 60 to 64 years . . . . . . 76.1% 43.5% 20.3% 9.3% 65 to 69 years . . . . . . 72.1% 38.9% 18.3% 8.0% 70 to 74 years . . . . . . 67.3% 34.9% 16.2% 6.7% 75 years and over . . . 60.7% 29.6% 13.3% 5.4% Source: US Census Bureau, Education Attainment, Issued 2003.
Population’s (age > 25) Education • US Numbers (2000 census) • 182+M people • 80.4% high school education • 51.8% some college or more • 24.4% college education or more • 8.9% advanced degree • Georgia Numbers • 5.2-M people • 78.6% high school education • 49.9% some college or more • 24.3% college education or more • 8.3% advanced degree Source: US Census Bureau, Education Attainment, Issued 2003.
60 Age 25-34 Age 45-54 40 20 0 Italy Spain Korea Japan Ireland Austria Poland Mexico Iceland Finland Greece Turkey France Norway Belgium Canada Sweden Portugal Hungary Germany Australia Denmark Netherlands Switzerland Luxembourg New Zealand United States United Kingdom Slovak Republic Czech Republic Differences in College Attainment (Associate and Higher) Between Young and Older Adults—U.S. and OECD Countries, 2004 Source: Organisation of Economic Cooperation and Development (OECD) -- NCHEMS
$30,000 High Income, Low Educational Attainment High Income, High Educational Attainment CT State New Economy Index (2002) Top Tier Middle Tier NJ Low Tier MA MD $25,000 CO VA NH NY DE MN Personal Income Per Capita, 2000 IL WA CA AK NV MI RI US FL HI WI GA OH OR PA VT KS IN NC AZ $20,000 MO IA ME NE TX TN WY SC AL UT KY ND ID OK SD NM MT LA AR WV MS Low Income, Low Educational Attainment Low Income, High Educational Attainment $15,000 15% 20% 25% 30% 35% 40% Percent of the Adult Population Ages 25 to 64 with a Bachelor’s Degree or Higher Georgia Source: Paul Lingenfelter, President, State Higher Education Executive Officers, 2008
Economic Context • Global economy • Global companies using global resources & markets • City States in Middle east investing in world economies • World supply & demand along with their currencies drive product trade • China investing $1B in adult training – realize must do more than just incoming workforce • ASEAN community seeking mobility in their workforce; training enables mobility if policies allow • Aalto University formed from 3 universities with industry and government input/support • ‘Must Do’ to be globally competitive
New Economy • 5 categories for measuring the new economy • Knowledge jobs • Globalization • Economic dynamism • Transformation to a digital economy • Technological innovation capacity • Georgia is 18th in 2007(same as 2002, 25th in 1997) Source: The 2007 State New Economy Index: Benchmarking Economic Transformation in the State, Robert Atkinson and Daniel Correa, published by the Kauffman Foundation and The Information Technology & Innovation Foundation
Rate of Change • Top 10 jobs in demand in 2010 did not exist in 2004 (Riley, Sec of Education) • Expected number of jobs an individual will have by age 38 is between 10-14 (Dept of Labor) • People change jobs every 4-5 years (Paton, IEEE Transactions on Education) • Half life of technology innovations • Employee interest in advancement vs business desires for employees’ productivity
Talent Crunch • Demographic shifts (aging, declining birthrates, economic migration), social evolution, globalization and entrepreneurial practices (outsourcing, cross-border recruiting, on-demand employment) • New jobs require new skills and retraining • Must recognize that talent strategies cannot focus solely on the top performers, that different things make people of different genders, ages, and nationalities want to work and that HR requires additional capabilities to develop effective solutions • Need for public-private partnerships Confronting the Talent Crunch: 2008, A Manpower White Paper
Contextual Impacts • US reduction in educational attainment • Aging population • Fewer people entering workforce • Rapid rate of knowledge creation • Thus, current workforce must meet the needs of a global economy • Therefore, education & training paramount Define USG Roles
USG CE Policy Update • Response to Context • Group working together • Redefined operating procedures in dramatic ways • Focus on quality enhancement and ability to meet needs
BoR Committee Members • Nelson Baker, Georgia Tech (Chair) • Ruth Bettandorff, University of Georgia • Tony Bretti, Georgia Southern University • Barbara Calhoun, Kennesaw State University • Diane Kilgore, Abraham Baldwin Agricultural College • Gary Means, Georgia Southern University • Jane O’Gorman, North Georgia College & State University • Jan Smith, University of Georgia • Artis Williamson, Georgia College & State University • Ex Officio: • Phil Allen, Georgia LEADS • Grover Andrews, Consultant • David Morgan, Consultant
Rationale for Updates • BoR changes • Funding elimination • Strategic plan • Absence of online course criteria • Movement towards outcomes based criteria; not always 80% attendance • Desire to better report our efforts to our community and BoR • Changes by SACS • 8 years since last reviewed
SACS Institutional Profile Non-Credit (Include continuing education. Do not include non-credit courses taken by for-credit students as part of a for-credit program such as labs, chapels, student success courses, remedial courses,etc. Count these under for-credit.) 6. a. For each non-credit course offered in the 2009 fall term, multiply the total number of contact hours for the course (as determined by your institution) by the total number of students enrolled in the course. Add resulting figures for all non-credit courses (See example below). ___________ b. Divide combined total in 6a by 168 if your institution is on a semester or trimester system (12 hours/week x 14 weeks), or by 120 if your institution is on a quarter system (12 hours/week x 10 weeks). Round to the nearest whole number ___________
Areas of CEU Updates • Online Course provisions • USG minimum number of contact hours for program certificate • Common credentials for attendees • Add third category of CEU • Articulation agreements for courses • Credit offerings • Reporting of CEUs • Governance structure
Definitions • Evaluation vs Assessment • Evaluation: methods for determining customer satisfaction with instructor, content, facility, etc • Assessment: measure learning outcomes achieved by student during class • CEU: Continuing Education Unit is defined as 1 CEU is equal to 10 contact hours of instruction
Online Courses • Provision added, Section 3.3 • Since no “seat time”, assess learning outcomes for awarding CEU’s • Determine CEU’s by either: • Benchmark course content against other providers • Comparison with face-to-face offering • Teach online pilot to determine
Program Certificate Level • Section 4.0, item 3, page 9 • Certificate of Program Completion • Minimum of 24 hours (2.4 CEU’s) • Demonstrates depth of knowledge/training in a focused topic • Approved: minimum 24 hours of Type I CEU for a non-credit certificate
Credentials for non-credit activities • Section 4.0, item 6, page 9 • Recognition of Course Completion • Awarded to participant for completing a single course • Has name of course, institution, date and CEU value along with participant’s name • Certificate of Program Completion in x ________ • Type I CEU courses only • Has name of program, institution, date with participant’s name • Discussion: these are the two credentials • Approved: greater recognition across State; measure of quality as compared to our peers operating in State
CEU Overview UCategory I Awarding institution knows the content; grants CEUs; assesses learning objectives; evaluates program; maintains permanent record. UCategory II Awarding institution knows the content, grants CEUs, learning objectives are not assessed, the program is evaluated and a permanent record is maintained UCategory III Institutional resources are used in substantial activities organized through agencies or organizations outside the institutional continuing education department.
Articulation Agreements • Section 4.0 • Provider determined • Allow for acceptance of courses towards taken elsewhere for own certificates • Encourages partnering • Demonstrates quality programs
Credit Programs • Section 7.0, page 12 • Allowance to offer credit programs in conjunction with academic faculty • Approved: move in a direction to offer programs such as degree completion etc that other states are doing; must adhere to campus and USG processes
Reporting • Many USG institutions have not regularly reported CEUs to System Office • Reporting collective efforts of CE programs informs others about our impact to citizens of Georgia • Mindful of time/resources needed to report • Approved: Effort must be reported
CEU Governance Process • Section 8.0, page 12-13 • Process: • Group recommends and discusses • The institutional rep of RACPSCE votes • If favorable vote, information forwarded to the Vice Chancellor for appropriate action • Approved by RACPSCE • Process used to approve/modify this Policy Manual
Implementation of the Vision • USG dialog for input & alignment • Already underway, working on communicating policy • Tie to metrics to show progress • Ties to employee jobs showing relevance • Ties to USG Strategic Plan, Goals 2, 3, and 6 • Focus on services to customers (USG, employers and students)
Challenges • Budgets • Faculty workloads • Responsiveness to market • Economy • Strong organizations invest in downturns • CE awareness and impact (internal and external) • Global business models • Generational aspects (awareness/learning) • Retirements • Closing of units
Opportunities • Impact to Higher Education: opportunities to collaborate and shared visibility • Abilities to • create revenue • be responsive to industry • take risk • fund new endeavors • ‘test waters’ for credit and research directions • promote university • Educational career long paths • Partnerships
Growth • Southern US advantages • Demographics – growing part of country • One of only 10 states with increasing populations • HOPE scholarships • Industry locating/relocating in south • Expansion leading to new jobs, new exciting careers and business requirements to stay competitive
Success Factors • Mission Extension/Alignment • Clear vision that all understand • Products align with university strength, market need and faculty interest • Organizational design supports vision • Business model to incentivize right people • Faculty involved, rewarded & encouraged • Educational delivery models map learners’ needs and support elements • Processes align for global support to all stakeholders • Choosing partners
CE Roles Knowledge Sharing Industry Instructors/ Faculty Leaves Multi-national Common Language/Training Universities Faculty/Instructors Papers Conferences Philanthropy Incubators Consulting Economic Development Relationships Partnerships Workforce Development Students Graduates, Co-op, Internships Technology/Knowledge Transfer Applied Research Dissemination Research Contracts Start-ups Technology Licensing Employees Industry/Government Industry/Government “Connections” University “Products”
Conclusion • Globalization, rate of knowledge creation, innovation for competiveness mean lifelong learning • Lifelong learning should be strategic for all stakeholders • Thus, what should the role of universities be in this new era; more of the 18-25 year olds or life span of all learners? • Become an advocate and be involved!
It is not the strongest of the species that survive,nor the most intelligent,but the ones most responsive to change. — Charles Darwin