Download

1 / 44
440 likes | 688 Views
Resident Curriculum Evaluation of Kidney Structure and Function. Signs/symptoms of renal disease. Kidney can: hurt bleed leak protein not perform its job correctly acid-base disturbance electrolyte disturbance fail to clear metabolic waste products

E N D
Resident CurriculumEvaluation of Kidney Structure and Function
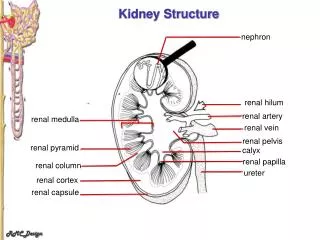
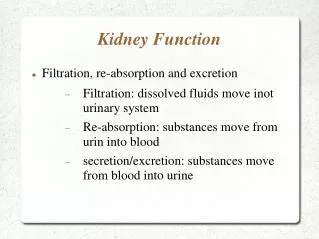
Signs/symptoms of renal disease • Kidney can: • hurt • bleed • leak protein • not perform its job correctly • acid-base disturbance • electrolyte disturbance • fail to clear metabolic waste products • volume disturbance- hyper/hyponatremia and hyper/hypovolemia
Signs/symptoms of renal disease • In general renal findings are non-specific • nausea, anorexia, lethargy, edema, dyspnea, decreased or increased urine output • Consequently Nephrologists must rely on lab studies to assist with the evaluation and diagnosis of kidney disease
Assessment of renal function • Serum creatinine • BUN • 24-hour creatinine clearance • 99mTc-DTPA or 99mTc-MAG 3
Assessment of renal function • FeNa • Urine lytes
Assessment of renal function • FeNa • Normal kidney excretes <25meq Na/day in pre-renal states • fractional excretion of sodium is an attempt to estimate the daily sodium excretion based on a SPOT sample • standard teaching • FeNa <1% = pre-renal • FeNa >1% = ATN
Assessment of renal function • FeNa • mathematically: • in steady state-- amount excreted = intake • therefore low sodium diet = low FeNa high sodium diet = higher FeNa • Amount of sodium excreted • ------------------------------------- • Amount of sodium filtered
Assessment of renal function = Amount excreted / amount filtered = meq Na/day excreted/ GFR x serum sodium Examples of routine errors: low value = pre-renal state • FeNa Normal diet and normal renal function = 100meq Na/day / 180 l/day x 140 = .39%
Assessment of renal function = Amount excreted / amount filtered = meq Na/day excreted/ GFR x serum sodium Examples of routine errors: -high value = ATN • FeNa Normal diet with Chronic renal failure = 100meq Na/day / 20 l/day x 140 = 3.5%
Assessment of renal function • FeNa • an estimate only-- 24hour urine for Na is a better estimate of pre-renal vs. ATN • a low value makes ATN less likely, but doesn’t mean patient is pre-renal • a high value doesn’t rule in or out any disease process
Assessment of renal function • Urine lytes • Na-- surrogate to assess volume status • depends on normal kidney at baseline • no new or changed diuretic dosing • inaccurate in cases of metabolic alkalosis • Cl-- also a surrogate for volume status • only use is in cases of metabolic alkalosis • K-- required for calculating urine anion gap and determining if kidney is handling potassium appropriately in cases of abnl serum K levels
Assessment of renal function • Urine lytes • creatinine • used to determine the adequacy of the urine collection • men-- 20-25mg/kg/day • women-- 15-20mg/kg/day • Urine anion gap • positives - negatives • (Na + K) - (Cl) • Normally negative • Useful for diagnosing renal tubular acidosis
Assessment of renal function • Urine anion gap • Urine cations • Na, K, and NH4 + • NH4 + is how the kidney excretes acid • Lab cannot measure NH4 + • Urine anion gap is a way to estimate the NH4 + • In Urine-- + = - or cations = anions • So if kidney working appropriately in the presence of metabolic acidosis it will increase NH4 + , to maintain electroneutrality kidney will increase Cl excretion • anion gap (Na+K-Cl) is negative • in an RTA-- no increased NH4 + , no increased Cl so anion gap remains positive
Assessment of renal function • Ultrasound • safe, easy, done at the bedside, no contrast or patient preparation • reveals renal size, the presence of absence of hydronephrosis, and an idea of the chronicity of renal disease
Assessment of renal function • Ultrasound • safe, easy, done at the bedside, no contrast or patient preparation • reveals renal size, the presence of absence of hydronephrosis, and an idea of the chronicity of renal disease
Assessment of renal function • Ultrasound • safe, easy, done at the bedside, no contrast or patient preparation • reveals renal size, the presence of absence of hydronephrosis, and an idea of the chronicity of renal disease
Assessment of renal function • Plain film-- KUB • renal or ureteral calculi are usually visible
Assessment of renal function • Computed Tomography
Renal Biopsy • Definitive test for evaluation of renal disease • high risk of complications • 1/10 bleed • 1/100 require transfusion • 1/1000 require surgery • 1/2500 lose the kidney • 1/5000 die • while it usually provides a diagnosis-- most nephrologic diseases have no specific treatment
Blood Pressure and Kidney Function Decline AJKD 2009 Normal? Renal Function
eGFR and Age • Kidney function deteriorated during follow-up • in the majority of patients. Mean yearly decrease • in eGFR was 1.00 2.71 mL/min/1.73 m2/y, • with the fastest deterioration in kidney function • in patients withAAAand those with albuminuria. • BP influenced the decrease in eGFR in patients • with albuminuria, but not in patients without albuminuria. • Systolic BP showed the strongest association • with eGFR decrease.
254 healthy adults, an annual decrease of 0.75 was shown during a period of 5-24 years 4,441 participants of the population-based study of Tromsø (mean age, 59 years), yearly eGFR decreases of 1.21 in men and 1.19 in women were reported (7 years of follow-up) 120,727 healthy Japanese adults aged 40-79 years, eGFR decreased 0.36 per year during 10 years 5,488 participants from the Prevention of Renal and Vascular End-Stage Disease (PREVEND) Study, annual eGFR decrease after a 6.5-year follow-up was 0.55 for men compared with 0.33 for women (mean age, 49 years). eGFR and Age
In the Baltimore Longitudinal Study of Aging, one-third of healthy elderly participants showedstability of kidney function during follow-up 27% of participants in the Tromsø study also did not experience an eGFR decrease. A similar result was found in our study, in which 35% of the study population did not show deterioration in kidney function during follow-up. eGFR and Age
In a large Japanese cohort, BP, • proteinuria, and baseline eGFR were significant • risk factors for a faster decrease in eGFR.27 Using • eGFR 60 mL/min/1.73 m2 to define kidney • function decrease, age, baseline eGFR, body • mass index, diabetes, smoking, hypertension, • and high-density lipoprotein cholesterol level • were predictive.10 In addition to these factors, • the Tromsø study found significant relations with • kidney disease stage, proteinuria, and uric acid • level
CrCl by 24hr urineUV/P (x 0.7 for units) • The creatinine clearance is usually determined from a 24 hour urine collection, since shorter collections tends to give less accurate results. (See "Patient information: Collection of a 24-hour urine specimen"). • Suppose that the following results are obtained in a 60 kg woman: • SCr = 1.2 mg/dL (106 µmol/L) UCr = 100 mg/dL (8800 µmol/L) V = 1.2 L/day • Thus: • CCr = [100 x 1.2]/1.2 = 100 L/day • This value has to be multiplied by 1000 to convert into mL and then divided by 1440 (the number of minutes in a day) to convert into units of mL/min. • CCr = [100 x 1000]/1440 = 70 mL/min
In the National Health and Nutrition Examination Survey in the United States, the mean serum creatinine values for men and women were 1.13 and 0.93 mg/dL (100 and 82 µmol/L), respectively (show figure 2) [15]. The normal values also varied by race. For non-Hispanic blacks, the mean SCr level in women was 1.01 mg/dL and 1.25 mg/dL in men, compared to non-Hispanic whites, where the mean SCr level in women was 0.97 mg/dL and 1.16 mg/dL in men and Mexican-Americans, where the mean SCr level in women was 0.86 mg/dL; and 1.07 mg/dL in men [15].
Cr Bump with Rhabdo • There are certain settings in which there may be an acute increase in creatinine production. One example is a recent meat meal. In addition, it has been suggested that the serum creatinine rises more rapidly with rhabdomyolysis (up to 2.5 mg/dL or 220 µmol/L per day) than with other causes of acute renal failure [17]. Release of preformed creatinine from injured muscle and/or release of creatine phosphate that is then converted into creatinine in the extracellular fluid have been proposed as explanations for this finding. However, neither of these mechanisms appears to account for most of the increase in the serum creatinine concentration [18]. An alternative explanation is that rhabdomyolysis often affects men with a high muscle mass and a higher rate of creatinine production than seen in frequently ill patients with other forms of acute renal failure [18].
However, the measurement of the clearance of urea is useful in one setting. Among patients with severe kidney disease (eg, a SCr greater than 4 mg/dL [354 micromol/L]), the urea clearance significantly underestimates the GFR. Since the creatinine clearance significantly overestimates this function, one method to estimate the GFR in these patients is to average both the creatinine and urea clearances [82]: • CCr + CUrea Estimated GFR = ———————— 2 • The 2005 European Best Practices Guidelines suggest that this calculation is preferred for estimating GFR in advanced kidney failure [83]. As previously mentioned, the MDRD equation can also be used in those with significantly decreased GFR. (See "Estimation equations" above).
Alternate Markers • Perhaps the best studied and most promising is cystatin C, a low molecular weight protein that is a member of the cystatin superfamily of cysteine protease inhibitors. Cystatin C is filtered at the glomerulus and not reabsorbed. However, it is metabolized in the tubules, which prevents use of cystatin C to directly measure clearance
Alternate Markers • Cystatin C is thought to be produced by all nucleated cells; its rate of production has been thought to be relatively constant, and not affected by changes in diet, although this is not proven. Cystatin C has been purported to be unaffected by gender, age or muscle mass. However, higher cystatin C levels have now been associated with male gender, greater height and weight, and higher lean body mass [80,85,86]. Cystatin C levels increase sharply with age [80]. Analysis of a subsample of 7596 participants drawn from NHANES III revealed that more than 50 percent of individuals over age 80 have an elevated cystatin C level, and non-Hispanic whites and males have higher levels of cystatin C [87]. These data were not adjusted for GFR; therefore, it is unclear whether they are related to different levels of kidney function among the populations or difference in the non-GFR determinants of cystatin C. In addition, cystatin is affected by hyper- and hypothyroidism, and has been correlated with markers of inflammation (C-reactive protein), body size (in particular fat mass), and diabetes [80,88,89]. Together, these data suggest that levels of cystatin C are affected by factors other than GFR. • Although reference ranges have been reported, there is no current standard for serum cystatin C measurements [90,91]. In addition, testing for cystatin C is only available in a limited number of laboratories • Estimation equations based on serum cystatin C have also been formulated [103-105]. It has been proposed that cystatin C-based equations would be more accurate in populations with lower creatinine production, such as the elderly, children, renal transplant recipients, or patients with cirrhosis [14,106,107]. In one study of over 3000 patients with known CKD, an equation for the estimated GFR based upon cystatin C was nearly as accurate as GFR estimated from the serum creatinine adjusted for age, sex, and race when compared to GFR measured by iothalamate clearance [100]. The addition of age, sex and race to cystatin C reduced bias in some subgroups defined by these variables, and an equation that uses both serum creatinine and cystatin C with age, sex and race was better than equations that used only one of these markers. • Steroid use may affect cystatin C levels, therefore limiting its use in transplant recipients. As an example, for the same level of cystatin C, measured GFR was 19 percent higher in transplant recipients than in patients with native kidney disease [14]. • Although cystatin C appears to be more accurate for the assessment of GFR than serum creatinine in certain populations, whether measurement of cystatin C levels will improve patient care is at present unknown
Look Up • Lowering uric acid to preserve renal function • Change in scr with nephrectomy
Cr Bump with Rhabdo • Requires stable renal function– nephrectomy example
Cr Bump with Rhabdo • TILimitations of creatinine as a filtration marker in glomerulopathic patients. AUShemesh O; Golbetz H; Kriss JP; Myers BD SOKidney Int 1985 Nov;28(5):830-8. To determine the reliability of creatinine as a measure of the glomerular filtration rate (GFR), we compared the simultaneous clearance of creatinine to that of three true filtration markers of graded size in 171 patients with various glomerular diseases. Using inulin (radius [rs] = 15 A) as a reference marker, we found that the fractional clearance of 99mTc-DTPA (rs = 4 A) was 1.02 +/- 0.14, while that of a 19 A rs dextran was 0.98 +/- 0.13, with neither value differing from unity. In contrast, the fractional clearance (relative to inulin) of creatinine (rs = 3 A) exceeded unity, averaging 1.64 +/- 0.05 (P less than 0.001), but could be lowered towards unity by acute blockade of tubular creatinine secretion by IV cimetidine. Cross-sectional analysis of all 171 patients revealed fractional creatinine secretion to vary inversely with GFR. This inverse relationship was confirmed also among individual patients with either deteriorating (N = 28) or remitting (N = 26) glomerular disease, who were studied longitudinally. As a result, changes in creatinine relative to inulin clearance were blunted considerably or even imperceptible. We conclude that true filtration markers with rs less than 20 A, including inulin, are unrestricted in glomerular disease, and that creatinine is hypersecreted progressively by remnant renal tubules as the disease worsens. Accordingly, attempts to use creatinine as a marker with which to evaluate or monitor glomerulopathic patients will result in gross and unpredictable overestimates of the GFR. • Variations in creatinine secretion — In early renal disease when the GFR is still near normal, an initial decline in GFR may lead to only a slight increase (0.1 to 0.2 mg/dL [9 to 18 µmol/L]) in the SCr because of an increase in proximal tubular creatinine secretion. The net effect is that patients with a true GFR as low as 60 to 80 mL/min (as measured by the clearance of a true filtration marker such as inulin or radioisotopic iothalamate or DTPA [3,19,20]) may still have a SCr that is ≤1.0 mg/dL (88 µmol/L) [8]. Thus, a relatively stable SCr in the normal or near-normal range does not necessarily imply that the disease is stable. However, once the SCr exceeds 1.5 to 2 mg/dL (132 to 176 µmol/L), the secretory process is effectively saturated and a stable value usually does represent a stable GFR [8].
Drugs Which Elevate Creatinine • Creatinine is an organic cation in the physiologic pH range and is secreted by the organic cation secretory pump that can be inhibited by other organic cations. The antimicrobial trimethoprim (which is most often given in combination with sulfamethoxazole) and the H2-blocker cimetidine are drugs that can inhibit this process, resulting in a self-limited and reversible rise in the SCr of as much as 0.4 to 0.5 mg/dL (35 to 44 µmol/l) • Serum creatinine is most often measured by the alkaline picrate method. This colorimetric assay can recognize other compounds as creatinine chromagens, particularly acetoacetate in diabetic ketoacidosis [6]. In this setting, the SCr can rise by 0.5 to 2 mg/dL or more (44 to 176 µmol/L), a change that is rapidly reversed with insulin therapy. Cefoxitin and flucytosine are other drugs that can produce a similar effect • The SCr varies during the day, rising by as much as 0.5 to 1.0 mg/dL (44 to 88 µmol/L) after a large cooked meat meal (since muscle contains creatine which is converted to creatinine by the heat from cooking) and then returning slowly to the baseline level
Intralab variability • Differences in method and equipment may also affect serum creatinine measurements [10]. In a study evaluating over 5000 laboratories using 20 different instruments to measure serum creatinine by up to three different methods (alkaline picrate and enzymatic), the mean serum creatinine concentration on a standardized sample ranged from 0.84 to 1.21 mg/dL (74.3 to 107 micromol/L) [25]. Bias related to instrument manufacturer was greater than that due to method
Intralab variability • Differences in method and equipment may also affect serum creatinine measurements [10]. In a study evaluating over 5000 laboratories using 20 different instruments to measure serum creatinine by up to three different methods (alkaline picrate and enzymatic), the mean serum creatinine concentration on a standardized sample ranged from 0.84 to 1.21 mg/dL (74.3 to 107 micromol/L) [25]. Bias related to instrument manufacturer was greater than that due to method
Improving the Lab • Cockcroft-Gault equation — The Cockcroft-Gault equation allows the creatinine clearance to be estimated from the serum creatinine in a patient with a stable serum creatinine [29]: • (140 - age) x lean body weight [kg] CCr (mL/min) = —————————————————— Cr [mg/dL] x 72
Improving the Lab • Several equations were derived from data on adult patients enrolled in the MDRD Study who had GFR measured at baseline using urinary clearance of iothalamate [31]. The six variable equation was described in the original publication: • GFR, in mL/min per 1.73 m2 = 170 x (SCr[mg/dL])exp[-0.999] x • (Age)exp[-0.176] x (BUN [mg/dL])exp[-0.170] x • (Alb [g/dL])exp[+0.318] x (0.762 if female) x (1.18 if black)
Improving the LabCKD EPI Equation • The CKD-EPI equation was developed to provide a more accurate estimate of GFR among individuals with normal or only mildly reduced GFR (ie, above 60 mL/min per 1.73 m2) [72]. This equation was developed using data pooled from 10 studies and validated against data derived from 16 additional studies, in which the gold standard was direct measurement of GFR using external filtration markers (eg, iothalamate). The study population included people with and without kidney disease who had a wide range of GFRs. • In the validation dataset, the CKD-EPI equation was as accurate as the MDRD study equation among individuals with estimated GFR less than 60 mL/min per 1.73 m2 and substantially more accurate among those with higher GFRs. When both equations were used to estimate GFR in over 16,000 NHANES participants, GFR estimates by CKD-EPI were higher than estimates obtained using the MDRD Study equation among individuals with a measured GFR greater than 30 mL/min per 1.73 m2. As a result, the overall prevalence of CKD was lower when the CKD-EPI equation was used to define the CKD population (13.0 versus 11.5 percent).
CrCl by 24hr urineUV/P (x 0.7 for units) • CCr x 1.73/BSA = [70 mL/min x 1.73] / 1.5 = 80 mL/min per 1.73 m2 • In turn, for a large person with a body surface area of 1.9, the adjusted CCl would be 64 mL/min per 1.73 m2.