Download
1 / 7
70 likes | 485 Views
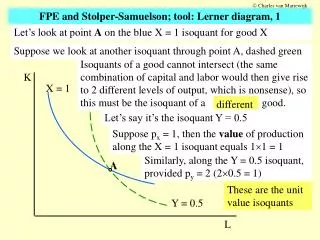
Charles van Marrewijk. K. X = 1. A. L. FPE and Stolper-Samuelson; tool: Lerner diagram, 1. Let’s look at point A on the blue X = 1 isoquant for good X. Suppose we look at another isoquant through point A, dashed green.

E N D
Charles van Marrewijk K X = 1 A L FPE and Stolper-Samuelson; tool: Lerner diagram, 1 Let’s look at point A on the blue X = 1 isoquant for good X Suppose we look at another isoquant through point A, dashed green Isoquants of a good cannot intersect (the same combination of capital and labor would then give rise to 2 different levels of output, which is nonsense), so this must be the isoquant of a good. different Let’s say it’s the isoquant Y = 0.5 Suppose px = 1, then the value of production along the X = 1 isoquant equals 11 = 1 Similarly, along the Y = 0.5 isoquant, provided py = 2 (20.5 = 1) These are the unit value isoquants Y = 0.5
Charles van Marrewijk Note that at point B the value of K production of good X is 1 and the cost is also 1 X = 1 1/r B C Y = 0.5 1/w L FPE and Stolper-Samuelson; tool: Lerner diagram, 2 One unit of cost for the producer is given by wL+rK = 1 In the figure this is given by a straight line with slope w/r and intercept 1/r for K and 1/w for L. At any other point on the X = 1 isoquant the cost of production is higher Similarly, for point C on the Y = 0.5 isoquant Production of both goods simultaneously is only possible if this figure is consistent
Charles van Marrewijk FPE and Stolper-Samuelson; tool: Lerner diagram, 3
Charles van Marrewijk K X = 1 1/r B C Y = 0.5 1/w L FPE and Stolper-Samuelson; FPE, 4 Given the prices of final goods px and py the unit value isoquants are determined exactly. They are drawn here in the figure There is only isocost line which touches these two isoquants one This determines the values 1/r and 1/w exactly This implies that if trade between two countries equalizes the prices of final goods and these two countries have identical CRS production functions, then the reward to factors of production w and r are also equalized (FPE)
Charles van Marrewijk K one X = 1 exactly 1/r B C Y = 0.5 1/w L FPE and Stolper-Samuelson; FPE, 5 Similarly, the prices of inputs w and r give the unit cost line There is only isoquant for good X which touches it one This determines the price px exactly Similarly, there is only isoquant for good Y which touches the isocost line; this determines the price py There is a one-to-one correspondence between the prices of final goods and the reward to factors of production
Charles van Marrewijk Suppose the price of good X increases to px = 5/4; this shifts the unit value isoquant for good X to 0.8 K X = 1 1/r 1/r to 1/r’, so r falls rises B 1/w to 1/w’, so w rises falls 1/r’ C B’ C’ Y = 0.5 1/w 1/w’ L FPE and Stolper-Samuelson; Stolper - Samuelson, 6 Take a situation as depicted in the figure and note that good X uses relatively more capital than good Y (slope of line through origin) inward As a result the isocost line touching the unit value isoquants rotates counter-clockwise To touch at B’ and C’ Study guide Picture 6
Charles van Marrewijk To summarize: the price of good X rises, this results in a rise in the rental rate of capital (the input used intensively in the production of good X) and a fall in the wage rate (the other input) This is the Stolper-Samuelson theorem K X = 1 1/r B 1/r’ C B’ C’ Y = 0.5 1/w 1/w’ L FPE and Stolper-Samuelson; Stolper - Samuelson, 7 It generalizes to arbitrary settings in terms of ‘friends’ and ‘enemies’: if the price of a final good rises the reward to some input rises and to some other input falls Also note that the rise in r and the fall in w causes a substitution away from capital in the production of both goods X and Y