Download
1 / 29
300 likes | 568 Views
From EMME to DYNAMEQ in the city of MALMÖ. www.m4traffic.se Johannes.Ostlund@m4traffic.se Anders.Bernhardsson@m4traffic.se. BACKGROUND. BACKGROUND. City of Malmö Founded the year 1250, became part of Sweden in 1658. About 300 000 inhabitants

E N D
www.m4traffic.se Johannes.Ostlund@m4traffic.se Anders.Bernhardsson@m4traffic.se
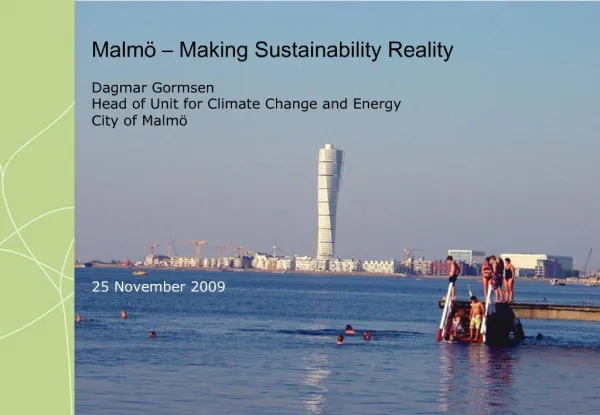
BACKGROUND • City of Malmö • Founded the year 1250, became part of Sweden in 1658. • About 300 000 inhabitants • 30 % of population represent 170 different countries. • University with 20 000 students. • Everydaymorethan 70 000 people make the 30 minutetripbetween Malmö and Copenhagen using the Öresund bridge. • Part of the transnational region of Öresund with 3.5 million inhabitants • Expectedincreaseof population with 33 % in the next 20 years
EXAMPLES OF ONGOING PROJECTS IN THE MALMÖ AREA Interchange Alnarp Malmö – Copenhagen Metro Developement area NorthernHarbour InterchangeSpillepengen Developement area Western Harbour InterchangeFlansbjer Developement area - Sorgenfri Developement area Limhamn Tram Tram Developement area Kalkbrottet Developement area Hyllie Interchange Arena
BACKGROUND • The city of Malmö is currently going through massive changes in its infrastructural design • New areas developed for living and working - the city prepares for a 33 % increase of population next 20 years • To meet the expected increase of travel, the city is planning different measures in the transport infrastructural design, such as tram, fastlanes for busses, better bike facilitys, motorway interchanges etc • Historically the city of Malmö have used static assignment models, such as Emme s a planning tool for different measures in the road infrastructureon a global level and microsimulation on a local level • Due to the expected increase of travel both within the city and commuting to- and from the growing region of Öresund the need of a planning tool with better possibilities to measure congestion has grown • Growing interest in what way different measures will affect route choices, queue lengths, travel times etc. both in shorter time horizons and in more strategic time horizons (20+ years)
ROAD NETWORK OF THE EMME MODEL • 1 595 Zones • 14 000 Nodes • 40 000 Links • 1 900 Turnpenalties • Includes Själland and Lolland/Falster in Denmark • Used by the Swedish Transport administration • Demand from the Sampers model.
EMME NETWORK IN MALMÖ – SUBAREA OF THE REGIONAL MODEL • 226 Zones • ~1 000 Turnpenalties • Demand from local implementation of the Sampers model
TRANSIT NETWORK OF THE EMME MODEL National & Regional railways City public transport system Numberoftransitlines in network
EMME DYNAMEQ Network DYNAMEQ EMME ArcGIS • Detailedediting: • Transit lines • Traffic signals • Intersectiondesign • Group editing: • Link facilitytypes • Freeflowspeeds • Lanes (not intersections) • Base data: • Links • Centroids
EMME DYNAMEQ Demand Peak hours PM SAMPERS/ EMME Converter Peak hours AM 24-Hour Demand Demand Time Time
DYNAMEQ DTA Peak hours AM 24-Hour Peak hours PM Generalizedcost = cost + 20 * Length
DYNAMEQ Results
DYNAMEQ Results
DYNAMEQ 24 – hours DYNAMEQ EMME 20 000 v/d 19 000 v/d 19 000 v/d 21 000 v/d 18 000 v/d 18 000 v/d 19 000 v/d 19 000 v/d 16 000 v/d 16 000 v/d 17 000 v/d 20 000 v/d 23 000 v/d 21 000 v/d 16 000 v/d 15 000 v/d 22 000 v/d 22 000 v/d
EMME vs DYNAMEQ Networktraveltimes during AM peak hour: Dynameq versus EMME OD-relations within the City of Malmö RatioDynameq/Emme
EMME Networktraveltimeswith and without the useoftpfin EMME OD-relations within the City of Malmö
EMME Route choice Without and WithTpf (uncalibrateddemand from Sampers) No Tpf (185 counts) Y = -426+1.16x; R2 = 0.76 Tpf (185 counts) Y = 280+0.98x; R2 = 0.82
CONCLUSIONS From EMME to DYNAMEQ • Network: ArcGISpowerfultooltoeditlargenetworks • Demand: Need for moredetailed data (time + centroids) • DTA: Peak hours and 24-hours - different aims and challenges • EMME v.s. DYNAMEQ: significantdifferences in traveltimes • raisesquestionsabout the validityofdemandmodellingand cost- benefit analyses basedon EMME in congestednetworks? • EMME: The useoftpf (not default in Sweden) affects route choice and traveltimes in a significantway