Download
1 / 33
330 likes | 479 Views
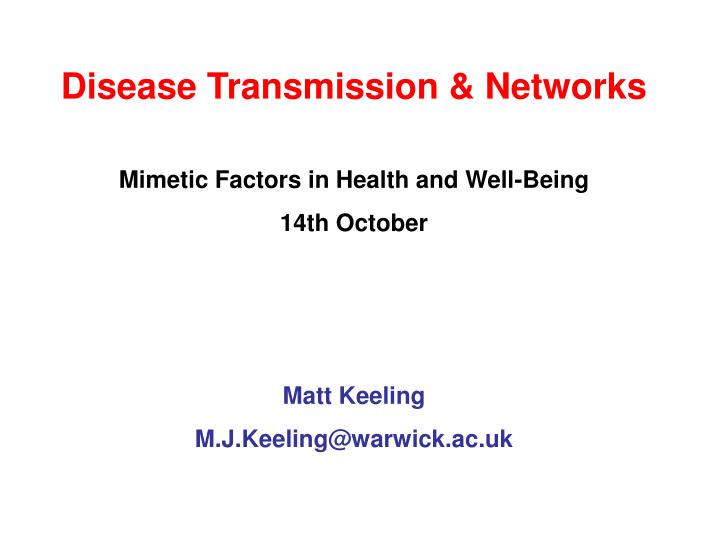
Disease Transmission & Networks Mimetic Factors in Health and Well-Being 14th October Matt Keeling M.J.Keeling@warwick.ac.uk. Disease Models without Networks. Susceptible : can catch the disease. S. dS dt. = B – b S I – dS. Infectious:

E N D
Disease Transmission & Networks Mimetic Factors in Health and Well-Being 14th October Matt Keeling M.J.Keeling@warwick.ac.uk
Disease Models without Networks
Susceptible: can catch the disease S dS dt = B – b S I – dS Infectious: have caught the disease and can spread it to susceptibles I dI dt = b S I – gI – dI Recovered: have recovered from the disease and are immune. R dR dt = gI – dR Standard Models for Diseases
dS dt = B – b S I – dS dI dt = b S I – gI – dI dR dt = gI – dR Standard Models for Diseases These three simple ODEs have provided huge advances in understanding disease dynamics. Such models provide an excellent description of the large-scale dynamics of diseases. Accurately predicting epidemic size, duration and frequency. However, recent experience with Foot-and-Mouth in 2001 and SARS in 2002, have shown that these models are only approximations to the complex transmission mechanisms that exist.
Examples of Disease Transmission Networks
The Network Approach The Network Approach A more complete, and realistic, method of capturing disease spread is to explicitly model the contacts of an individual. These contacts can both bring infection to that individual and take infection from that individual out into the population. Obviously, we don't just create connections from one individual, instead individuals may be interconnected. When we consider an entire population with all their connections we have created a transmission network that defines the possible epidemic scenarios.
Types of Network: Scale-free Information on www links is abundant and provides some insights into network structure. Although not directly application to disease spread, the parallels with computer viruses are clear. Nodes such as the Microsoft web- site act as super-spreaders, and are the prime target of computer viruses In these networks the probability of having exactly n connects is a power law: P(n) n –2.8
Types of Network: the small-world This type of network was made famous by the work of Watts and Strogatz in 1998. It begins as a 1-dimensional lattice, with each individual connected to the nearest k neighbours. Random long-range links are then added, such that infection can rapidly spread to new areas of the lattice. The dynamics of diseases on small-worlds is a mixture of local wave-like spread and jumps to new territory. Problems: • There is a rigid lattice structure. • Homogeneous – all individuals have k contacts.
The coastline surrounding the North Sea contains many haul-out sites where seals congregate. In general seals frequent a set of local haul-outs, leading to localised transmission and a circular network. However, meetings at feeding grounds in the middle of the North Sea can lead to occasional long distance transmission -- a small world? Types of Network: examples The phocine distemper epidemic of harbour seals in the North Sea gives an example of a Small-World network.
Types of Network: STI Note the few very high-risk individuals.
Household members Cousin Clusters Mother + Brother Mother + Father Teacher at party Youth Club Cousins Boy in adjacent hospital cubicle The Boyfriend Shop assistant in Chemists Photographer in Anatomy Department (Birmingham) Grandchildren Old man in Pub Sister + 2 Brothers Friend and his brother Clusters Bus passengers Blackpool trip Hitchhiker in Café Clusters Types of Network: 1966 Smallpox, UK random contacts Long-range jumps Q: How do we make sense of this complex pattern?
Small-worldness Occasional random encounters, such as on crowded public transport or in lecture theatres, can lead to the rapid spread of infection to distance parts of the network. Types of Network: what is required? There are clearly many ways to form a network, and many ways in which to describe the properties of a network. Three basic elements appear to be common to most known disease networks: Heterogeneity Individuals should have different numbers of connections. Some 'super-spreaders' should be highly connected. Clustering/Cliques Contacts should be clustered. Groups of individuals usually know each other and can spread infection between them.
… there are strong connections within households … and strong connections between social/family contacts … there are also contacts made at work or school …finally there are random contacts Consider a population of individuals…. Q: How do we make sense of this complex pattern?
Implications of Disease Transmission Networks
We can take repeated stochastic simulations of an epidemic on a complex network, and find the mean and confidence interval. To improve our understanding, we can fit a standard ODE epidemic to this data, allowing the transmission rate and susceptible population size to vary. While the main part of the epidemic is a very good fit, the early phase fails dramatically. This is because for the bulk of the network epidemic the effective transmission rate has achieved a low asymptote – due to spatial correlations. Relative to the main body of the outbreak, the early epidemic grows far faster. Diseases on Networks
Pair-wise Model Results At first glance the pair-wise epidemic looks like the standard epidemic.
Pair-wise Model Results Initial r0 } Asymptotic r0
Heterogeneity comes from the UK census data on house-hold occupancy. Household Networks To add greater realism, we now include household structure. We assume all members of a household are an interconnected clustered network, with rapid transmission. We assume transmission between households is far weaker and random.
Most high r0 (high occupancy) wards occur in inner-city regions. Spatial Distribution of Humans. There are significant regional differences in the average size of households. Here we show the impact of household structure on the Asymptotic growth rate, r0.
An ideal scheme has huge advantages but is practically unworkable… we need to look for an suitable alternative. Vaccination of Households and In contrast to the FMD models, we find a significant departure from theory when considering the vaccination of people against pandemic ‘flu.
Only 9 out of 10,000 wards perform better with random vaccination. These tend to be locations with high student populations or rural areas with many ‘non-dependent’ children still at home. Vaccination of Households and Children. We now examine the critical question of whether vaccinating children is better than random.
Parameterising Disease Transmission Networks
POLYMOD This was a pan-European diary based questionnaire that focused on the mixing between age-groups. These results have been extensively used in the 2009 H1N1 outbreak of “swine flu”.
Diary Survey at Warwick A more long-term diary based survey was performed by staff and students at Warwick (Biology). This gave us confidence that answers for a single day correspond well to a long-term average -- generally. This also highlighted the importance of clustering within the network. What is clustering?
i) Triangular connections. ii) Fewer contacts per generation. iii) Multiple paths to each contact. Clustering in Networks The Cayley Tree. Each individual has exact n contacts in an ever branching tree. Analytical results can often be found. Although we still have fixed n. Clustering leads to:
Social Contact Survey Postal Survey On-line Survey
Clustering in very strong in these networks, especially within the home and at work. Examples of alter-ego networks. Social Contact Survey
What is missing from Disease Transmission Networks?
Panic These are the number of google searches for “swine-flu” (or the equivalent) from different countries. It gives some indication of the level of national concern. What are the implications of such concern?
School term-time Schools restart Weekly increase School Holidays … however, at the peak of media attention we actually observed an increase in the rate that new cases were reported -- this was probably due to more people reporting mild symptoms. Panic Concern could lead to social distancing, reducing transmission….
Different forms of touch may have different transmission risks. Similarly, meetings in different social environments may need to be treated differently. Interpreting Contacts Transmission is context dependent.
Illness The final thing that we have neglected is the illness itself. Once infectious a patient is often too ill to move and participate in their usual activities. Illness is likely to strengthen transmission within a family (but may depend on caring roles) and weaken social and work-based transmission.