Download
1 / 26
260 likes | 369 Views
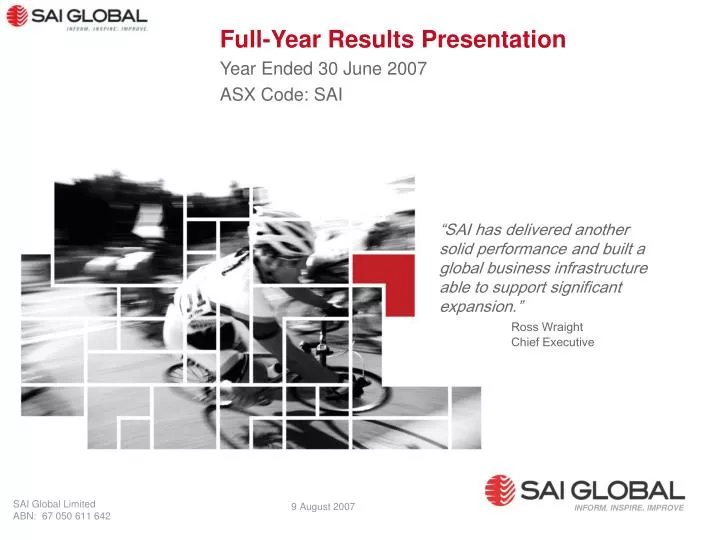
Full-Year Results Presentation Year Ended 30 June 2007 ASX Code: SAI. “SAI has delivered another solid performance and built a global business infrastructure able to support significant expansion.” Ross Wraight Chief Executive. SAI Global Limited ABN: 67 050 611 642. 9 August 2007.

E N D
Full-Year Results Presentation Year Ended 30 June 2007 ASX Code: SAI “SAI has delivered another solid performance and built a global business infrastructure able to support significant expansion.” Ross Wraight Chief Executive SAI Global Limited ABN: 67 050 611 642 9 August 2007 INFORM. INSPIRE. IMPROVE
Disclaimer The material contained in this document is a presentation of general information about SAI Global Limited’s activities current as at the date of this presentation 9 August 2007. It is provided in summary and does not purport to be complete. You should not reply upon it as advice for investment purposes as it does not take into account your investment objectives, financial position or needs. These factors should be considered, with or without professional advice, when deciding if an investment is appropriate. To the extent permitted by law, no responsibility for any loss arising in any way (including by way of negligence) from anyone acting or refraining from acting as a result of this material is accepted by SAI Global Limited or any of its related bodies corporate.
Agenda 1. Results & Highlights 2. Financial Overview 3. Operational Performance 4. Outlook • Q and A
1. Results & Highlights Ross Wraight Chief Executive Officer
Financial Outcomes • Underlying Business Performance • Revenue1 up 33.3% to $212.8 million • EBITDA up 43.7% to $43.2 million • EBITDA marginup from 18.8% to 20.3% • Reported Results • NPAT up 34.1% to $18.8 million • EPS up 4.8% to 13.1 cents (on expanded share capital) • Underlying Cash Earnings • Cash earnings up 29.2% to $25.3 million, • Cash earnings per share up marginally to 17.6 cents (on expanded share capital) • Excludes interest income
Financial Outcomes • Operating cash flow strong at $27.3 million up 25.1% from $21.8 million • Cost to income ratio down to 81.6% from 82.8%, despite increased investment in resources and infrastructure • Dividend per share of 11.0 cents up from 10.4 cents last year. Franking reduced to 85%, as flagged at the half-year • Total dividend payment of $15.8 million up 18.1% • Net assets down 3.4% from $192.6 million to $186.1million, due to appreciating Australian dollar, and high payout ratio • Current gearing ratio 34.3%
Business Performance • Solid organic growth, excellent Publishing performance and acquisitions drove the Company’s continued strong revenue and profit growth • Organic growth solid at 6.3% for three core divisions – weak second half sales in Professional Services reduced overall organic growth to 5.0% • Corporate infrastructure roll out across group - finance, IT, HR and branding/marketing • Significant integration within Compliance and Publishing divisions • Significant investment in sales staff, particularly in the Compliance business in the last quarter • Professional Services delivered a strong profit result despite soft sales in North America • China joint venture commenced commercial operations and New Zealand JV established • Acquisition pace maintained – Certo, Midi and ROOR • Improvement in brand recognition and customer satisfaction
Total Shareholder Return From listing to 30 June 2007 relative to S&P/ASX 300 Index 300.0% 258.0% 250.0% 200.0% 162.2% 150.0% 92.2% 100.0% 50.0% 23.0% 0.0% 25th 50th 75th SAI Global percentile percentile percentile Total Shareholder Return
2. Financial Overview Geoff Richardson Chief Financial Officer
Impact of appreciating Australian dollar • Immaterial impact on FY07 result because the reduction in the value of US profits relative to FY06 has been offset by increases in the value of profits denominated in British pounds. • Estimated impact relative to FY06: • Revenue reduced by $373K • EBITDA reduced by $ 93K • Larger adverse impact expected next year, covered on “outlook” slide • Adverse impact on net assets due to re-translation of net assets denominated in US dollars and British pounds at period end rates, reflecting the full appreciation of the A$ against these currencies. This impact is reflected in the movement in the foreign currency translation reserve.
3. Operational Performance Tony Scotton Chief Operating Officer
Business Publishing • Strong revenue and profit growth driven by: • Strong organic growth in Property Information and Standards Publishing • Full 12 months inclusion of acquisitions • EBITDA margins higher at 31.8% • Operational Focus • Integration of acquisitions into a single global Publishing Division • Appointment of a Global Head for the division • Global database and web shop development well advanced • 2008 Outlook - continued solid revenue and profit growth
Compliance Services • Strong revenue and profit growth driven by: • Continued solid organic growth at 10.1% • Inclusion of 5 1/2 months of Midi • Major focus on divisional integration • Management restructure • Delivery platform integration • Courseware integration • Establishment of regional sales and marketing business units • AML database acquired (ROOR) • Significant investment in business development resources – challenge bringing quality people on board in timely fashion • 2008 outlook – expect continued strong revenue and profit growth
Assurance Services • Continued revenue and profit growth – result includes full 12 months of EFSIS (6 months last year) and 9 1/2 months of Certo • Margins slightly lower – EFSIS and Certo at lower (but expanding) margins to the base business. • Solid growth in Food, OHS and Product Certification. • ISO 9000 not growing in mature economies – focus on value adding product • Recent acquisitions (EFSIS and Certo) performing ahead of business case • Global Head of Assurance commenced • Investment in key geographic areas: • Japan, China, India • 2008 Outlook – solid revenue and profit growth
Professional Services • Solid growth in Australian business but weak conditions in USA led to small revenue decline • Continued focus on cost base resulted in increased profit and EBITDA margins • Continues to be an important support activity to other businesses, particularly Assurance • Continued diversification away from purely standards related services towards business improvement products • Management integrated into Assurance Services from July 1 • 2008 Outlook – small revenue growth but increasing margins
5. Outlook • Demand for SAI’s products and services remains robust • More acquisitions likely • Directors expect continued dividend growth from current levels, having regard to future business conditions and opportunities, the level of retained earnings and the cash flow requirements of the company • The directors expect the next two dividends to be 85% franked • Forex Assumptions:1 AUD = .42 GBP and .84 USD
Revenue: Between $240.0 million and $245.0 million, implying growth of 12.8% to 15.1% Constant currency - between $247.0 million and $252.0 million, implying growth of 16.1% to 18.4% EBITDA: Between $50.0 million and $52.0 million, implying growth of 15.8% to 20.4% Constant currency between $51.0 million and $53. million, implying growth of 18.1% to 22.7% Amortization: $8.2 to $8.5 million Depreciation: $6.2 to $6.6 million Tax Rate: 30 -32 % Acquisitions: As per announcements