Download
1 / 13
130 likes | 150 Views
Explore scenarios using the North Carolina Local Foods Spreadsheet Model to analyze industries, economic contributions, job outcomes, and potential offsets. Learn to estimate economic footprints, address overestimation errors, and calculate productivity shifts.

E N D
North Carolina Local Foods Scenarios Using the North Carolina Local Foods Spreadsheet Model to introduce standard practices, terms, interpretation, and limitations
First, just to get familiar with the spreadsheet model • Understanding how the spreadsheet model works – using the construction sector first • We’re next going to compare the different outcomes from a set of industries • Grain and oilseeds versus fruits and vegetables -- notice the huge difference in both direct and total job outcomes • Next, food and kindred processing followed by meat and poultry – huge multipliers are driven significantly by assumptions that the factory is creating net-new farm activity. “Chicken-egg” and “but-for” become issues • This is a HUUUUUGE problem for novice modelers – they tend to overstate value-added agriculture outcomes
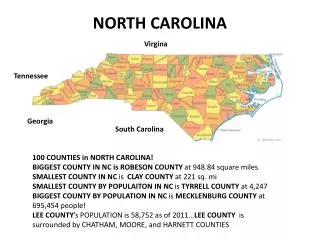
Spreadsheet model continued 2. Here we’re using data from the model to estimate the size of North Carolina fruits and vegetables industry – this is an economic contribution assessment. According to our NC SAM (in the Leontief Transformation tab), there was $605.4 million of vegetable and melon output and $143.7 million of fruit output in 2014. We want to assert the economic “footprint” of this sector of the state’s economy. What do we tell ag-sector stakeholders about F & V production in the state?
Note: This practice slightly over-estimates the total contribution • We have a very minor problem with double counting when we do this because the indirect and the induced jobholders eat fruits and vegetables and stimulate a total employment number in those sectors that is larger than the direct (and total value) in the model. • This overestimate is small, but is something you may have to confront. There is a simple method for offsetting the error that involves reducing the direct value(s) in your estimation by the magnitude of the error in that (or those) sector(s). • See me or write me if this is something you need to attend
A new production example 3. We’re going to replicate work that I did for the Leopold Center and for the state of Michigan back in 2010 with some updated number. We’ll pretend NC is Michigan • Let’s imagine very significant new production to meet seasonal fresh fruit and vegetable consumption by NC residents that is currently mostly satisfied from purchases from other states • We’re going to estimate the economic impact of that assumption • But we are also going to calculate “opportunity cost” offsets because all of the new land for this scenario is coming from existing grain (or tobacco or cotton) farming.
The numbers: Acre and direct output gains and offsets • We first shock the economy by F & V values • We offset the grain production opportunity costs • The difference represents the potential net new productivity to the state from this shift
4. Let’s do a food hub • We will use an “analysis by parts” (aka “bill of goods”) method • Requires us to use several sectors of your model simultaneously – here we have 14 • Requires us also to piece together the finished output so that it represents the whole of what was measured • This is a very simplified example. Good analysis by parts studies often include dozens of categories
But we need to parse these data into elements pertinent to our region – we have to estimate or discern a local purchase probability
But we’re not done yet! • The output from our Analysis by Parts only summarizes the indirect and the induced values, i.e., the amount of inputs purchased plus the results of the workers and the owners spending their labor incomes • We need to add to that the direct values. They are: • $400,000 in output excluding the cost of goods sold • $300,000 in labor income (payments to workers and proprietors) • 5 jobholders (including the proprietor)