Download
1 / 16
160 likes | 302 Views
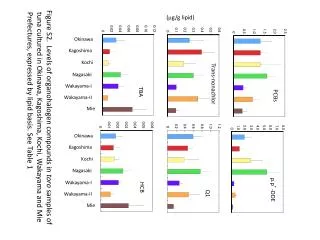
AC hysteresis losses in Y 0.5 Lu 0.5 Ba 2 Cu 3 O 7 superconductor. Ali Öztürk * and Selahattin Çelebi * * Department of Physics, Faculty of Science and Arts, Karadeniz Technical University, 61080 Trabzon, Turkey.

E N D
AC hysteresis losses in Y0.5Lu0.5Ba2Cu3O7 superconductor Ali Öztürk* and Selahattin Çelebi* *Department of Physics, Faculty of Science and Arts, Karadeniz Technical University, 61080 Trabzon, Turkey
Itwaspublishedthepapernamed “Theeffect of partialLu doping on magnetic behaviour of YBCO (123) superconductors” byOzturk et al. in Journal of AlloysandCompounds , 495, (2010), 104–107 [1]. Wehavefoundthatpartial (50 %) Lu doping to YBCO decreasesthetransitiontemperatureTc. improves the bulk criticalcurrentdensityand lower critical field (Hc1) in the low temperature region (at 20 K).
In this work we have investigated the 50% Lutetium doped YBCO superconductor prepared by conventional solid state reaction method by means of AC susceptibility measurements and theoretical analysis. • We measured the AC susceptibility of the sintered pellet as a function of temperature and AC magnetic field amplitude in the presence of static bias magnetic fields Hbdirected along Hac. • AC susceptibility measurements for the sample have also been performed as a function of AC field amplitudes (1-17 Oe) and frequencies (20-3020 Hz) at constant temperature (at 77 K).
The ac susceptibilities were measured with a commercial Quantum Design PPMS Model 6000 ACMS option. The dimensions of the Lu doped sample were 2.05 × 2.25 × 2.45 mm3. The sample was mounted with its length along the direction of the collinear magnetic fields. We display the temperature behaviour of the ac susceptibility for the Lu doped sample at various ac field amplitudes (rms) in Fig. 1, where Hb = 0. We normalized experimental ac susceptibility data ’(T) and ’’(T) to the |’| at the lowest temperature and the lowest field amplitude for each sample since the demagnetizing correction would cause = 1 for low enough temperature at low field amplitude. The loss peaks shift to lower temperature by increasing field amplitudes. The amount of the shift as a function of the field amplitude is proportional to the strength of the pinning force. Comparing any two samples, the larger the shift in the maxima of” , the weaker the pinningand hence the smaller jcm will be.
Figure 1. Temperature variation of ac susceptibility at field amplitudes Hacranging from 80 to 960 A/m with f=1 kHz for the Lu doped YBCO sample in the absence of Hb.
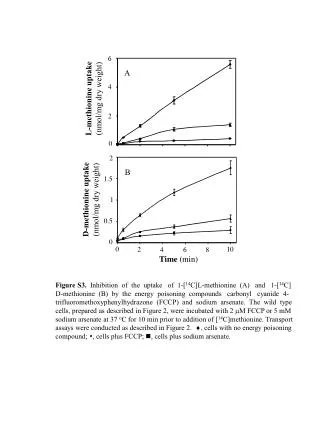
The following equations have been proposed by [2] to determine ’m , and ’’m , the contributions of the matrix susceptibility to the measured susceptibilities ’, and ’’ where fg denotes the effective volume of the grains. Applying the procedure described in [3] to the data of Fig.2 measured at Hac= 480 A/m we estimate fg 0.34. Neglecting field dependence for fgwe have calibrated all our measurements of ’’m accordingly.. Figure 2.χ’’, the imaginary part of the ac susceptibility, versus χ’, the real part of the ac susceptibility for applied ac field amplitudes Hac=480 A/m at a frequency f = 1 kHz in the absence of Hb.
Ha=Hb+Hac Figure 3.Temperature dependence of extracted matrix susceptibility ’’m for field amplitudes ranging from 80 to 1200 A/m with f = 1 kHz in the presence of a collinear static bias field Hb = 240 A/m.
Figure 3. Figure 4.A schematic representation of B profiles encountered for the same chosen Hb at the extremes of cycles in (a), (b), and (c), for different amplitudes Hac = Hmax − Hb = Hb − Hmin and for different temperatures T1> T2> T3, and in (d) for the same amplitude Hac, but for different temperatures T6> T2> T5> T4. (e) The T labels adjacent to the points on the curves of χ”mversus T/Tcm indicate their relationship with the corresponding limit profiles sketched in (a)–(d).
The relation between first penetration field for matrix H*m and the peak temperature Tp can be written as follows: Figure 3. where 0 is the pinning strength parameter at T=0, p is the temperature exponent of the pinning strength or critical current density, n is a parameter indicating the field dependence of the intergranular critical current density and R is the radius of the cylinder or half thickness of the slab.To describe the intergranular critical current density we exploited the well known empirical expression Figure 5.Plot of penetration field Hac as a function of peak temperature. Open circles are for experimental data and solid line is for the calculated best fit curve using the parameters given on the legend.
Pursuing the critical-state concept and Maxwell’s equation for idealized cylinder geometry, we developed expressions for the evolution of the configurations of the flux density profiles B(r) and their spatial average <B> for the complete variety of sweeps of Ha=Hb+Hac at different temperatures [4]. Since the integration of the area enclosed inside the hysteresis loops of <B> vs Ha yields W, the hysteresis loss per cycle per unit volume, the theoretical imaginary part of the susceptibility [5], which we call the normalized hysteresis losses, can be written as Hmax = Hb + Hac Hmin = HbHac Figure 6. (a) Temperature dependence of extracted matrix susceptibility m for field amplitudes ranging from 80 to 1200 A/m with f = 1 kHz in the presence of a collinear static bias field Hb = 240 A/m. (b) Theoretical calculations with parameters given on the legend
f = 1 kHz T= 77 K Hb = 0 Figure 7. (a) Imaginary part of AC susceptibility as a function of AC field amplitudes (1-17 Oe) at constant temperature (at 77 K).(b) Theoretical calculations with parameters given on the legend.
T= 77 K Hb = 0 Figure 8.Imaginary part of AC susceptibility as a function of frequency (20-3020Hz) at constant temperature (at 77 K).
Figure 8 Çelebi et al. (1998) [6]
Hac = constant Liu et al. 2005 [7] Figure 8
References (1) A. Özturk, İ. Düzgün, S. Çelebi, (2010), “The effect of partial Lu doping on magnetic behaviour of YBCO (123) superconductors”, Journal of Alloys and Compounds, 495 (2010) 104–107. (2) D.-X. Chen, A. Sanchez, T. Puig, L.M. Martinez and J.S. Munoz, “AC susceptibility of grains and matrix for high-Tc superconductors”, Physica C, 168 (1990) 652-667. (3) S. Çelebi, “Comparative AC susceptibility analysis on Bi-(Pb)-Sr-Ca-Cu-O high-T-c superconductors” Physica C, 316 (1999) 251 -256. (4) A. Öztürk, S. Çelebi, M.A.R. LeBlanc, “Observations and model of a new ac-lossvalley in a YBCO superconductor”,Supercond. Sci. Technol. 18 (2005) 1029-1034. (5) J.R. Clem 1992 Magnetic Susceptibility of Superconductors and Other Spin Systems, edited by R.A. Hein, T.L. Francavilla and D.H. Liebenberg (Plenum: New York) p 260. (6) S. Çelebi, I. Karaca, E. Aksu, A. Gencer, “Frequency dependence of the intergranular AC loss peak in a high-TcBi–(Pb)–Sr–Ca–Cu–O bulk superconductor”, Physica C, 309 (1998) 131–137. (7) S.L. Liu, G.J. Wu, X.B. Xu, J. Wu, H.M. Shao, X.C. Jin, “Frequency response of AC susceptibility in high temperature superconductors”, Solid State Communications, 135 (2005) 203–207.