Download
1 / 11
110 likes | 256 Views
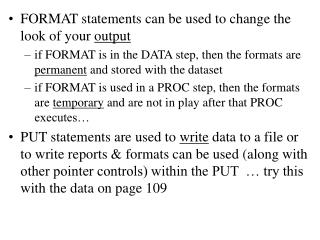
FORMAT statements can be used to change the look of your output if FORMAT is in the DATA step, then the formats are permanent and stored with the dataset if FORMAT is used in a PROC step, then the formats are temporary and are not in play after that PROC executes…

E N D
FORMAT statements can be used to change the look of your output • if FORMAT is in the DATA step, then the formats are permanent and stored with the dataset • if FORMAT is used in a PROC step, then the formats are temporary and are not in play after that PROC executes… • PUT statements are used to write data to a file or to write reports & formats can be used (along with other pointer controls) within the PUT … try this with the data on page 109
DATA sales; INFILE 'c:\MyRawData\Candy.dat'; INPUT Name $ 1-11 Class @15 DateReturned MMDDYY10. CandyType $ Quantity; Profit = Quantity * 1.25; PROC SORT DATA = sales; BY Class; PROC PRINT DATA = sales; BY Class; SUM Profit; VAR Name DateReturned CandyType Profit; FORMAT DateReturned DATE9. Profit DOLLAR6.2; TITLE 'Candy Sales for Field Trip by Class'; FOOTNOTE ‘USING FORMATS’ ; RUN;
DATA FOR THE PREVIOUS SLIDE Adriana 21 3/21/2000 MP 7 Nathan 14 3/21/2000 CD 19 Matthew 14 3/21/2000 CD 14 Claire 14 3/22/2000 CD 11 Caitlin 21 3/24/2000 CD 9 Ian 21 3/24/2000 MP 18 Chris 14 3/25/2000 CD 6 Anthony 21 3/25/2000 MP 13 Stephen 14 3/25/2000 CD 10 Erika 21 3/25/2000 MP 17 • USE THIS DATA TO WRITE THE NAME, QUANTITY SOLD AND PROFIT (IN DOLLAR FORMAT) TO A TEXT FILE NAMED CANDYOUT.TXT - try this…. PUT NAME @15 QUANTITY @18 PROFIT DOLLAR8.2;
This doesn’t do the job… the PUT statement without a FILE statement writes in the LOG window… • So add the following in the DATA step (can go after the INFILE for example…) FILE ‘path to file goes here’; • Check out section 4.6 on pages 110-111 for a small list of the standard formats that SAS uses… • If the FORMAT you want is not available you may write your own with PROC FORMAT;
PROC FORMAT creates your own formats that can later be associated with output through the use of a FORMAT statement (don’t forget the end “dot” when they are actually used) • The syntax requires one or more VALUE statements after the beginning PROC FORMAT statement. The VALUE statements give names for the formats (name must begin with $ if format is for character data) and tell what values of the variable will be associated with the formats: PROC FORMAT; VALUE namerange = “format value” … ; Character values being formatted must be in quotes. Ranges of values can be indicated in several ways (see bottom of p. 112)…
PROC FORMAT; VALUE $island ‘si’=‘Shell Island’ ‘ph’ = ‘Pizza Hut’; VALUE mass 0 - < 5 = ‘small’ 5-high = ‘large’; NOTE: For each variable in SAS there is: a construct the variable “measures” a name you give to the variable the values of the variable You may change the name for outputting with LABEL You may change the values for outputting with FORMAT (either SAS built-in ones or ones you write yourself with PROC FORMAT) See the example from p. 113:
DATA carsurvey; INPUT Age Sex Income Color $; datalines; 19 1 14000 Y 45 1 65000 G 72 2 35000 B 31 1 44000 Y 58 2 83000 W PROC FORMAT; VALUE gender 1 = 'Male' 2 = 'Female'; VALUE agegroup 13 -< 20 = 'Teen' 20 -< 65 = 'Adult' 65 - HIGH = 'Senior'; VALUE $col 'W' = 'Moon White' 'B' = 'Sky Blue' 'Y' = 'Sunburst Yellow' 'G' = 'Rain Cloud Gray'; PROC PRINT DATA = carsurvey; FORMAT Sex gender. Age agegroup. Color $col. Income DOLLAR8.; run; quit;
PROC MEANS options; • Other possible statements with PROC MEANS are: • BY varible-list; (makes MEANS do separate analyses for each level of vars. in the list; dataset must be SORTed by the variables in the list) • CLASS variable-list; (makes MEANS do as with BY, but has more compact output; dataset does not have to be SORTed) • VAR variable-list; (makes MEANS only operate on the variables in the list; if VAR statement is not there, then all numeric variables are analyzed) • Show the difference between BY and CLASS
PROC MEANS may be used to create new datasets with the OUTPUT statement; these new datasets contain the resulting statistics (mean, sum, etc.) by doing the PROC MEANS. The following example creates a new dataset (named STATS) containing the means and standard deviations of the mass and height variables from both marshes: PROC MEANS DATA=padgett; BY MARSH; OUTPUT OUT=stats MEAN(totmass plantht)=massmean htmean STD(totmass plantht)=masssd htsd; run; • Go over the example on page 119 for another look at this important method of creating new datasets in SAS…
PROC FREQ does frequency distributions for single variables and cross tabulations for two or more variables together… • TABLES varible-combinations ; is a required statement • the * between two variables creates a variable combination and signals that a cross tabulation is to be done. • options may be added to PROC FREQ by listing them after a slash (/) in the TABLES statement. Some key options for PROC FREQ are: • LIST which prints cross tabulations in list format instead of tabular form • MISSING includes missing values in the distributions (and hence in the computations) • NCOL and NROW supresses the printing of the column and row percentages respectively in cross tabulations • OUT=dataset_name; creates a dataset of frequencies. • TRY THESE OUT ON PADGETT DATA…
For Wednesday: • Read Chapter 4 up through 4.7, 4.9-4.11 • HW: 1. write a series of PROC FORMATs so we may better understand the oscars dataset (e.g., gender, born in u.s., etc…); test them out and then send me the file with your SAS code… 2. try out the new results for PROCs MEANS and FREQ on the same dataset… • Be prepared to work on reporting: • using the PUT statement along with FILE (4.8) • using PROC TABULATE (4.12-4.16) • using PROC REPORT (4.17-4.21) • Start looking for your own dataset to analyze for the midterm …