Download
1 / 18
180 likes | 310 Views
This lesson explores the role of hunting permits in managing animal populations, focusing on deer and their predators, wolves. It discusses the implications of increased deer hunting permits on ecological balance, considers the trophic levels of deer as heterotrophs and wolves as carnivores, and examines exponential growth patterns in bacterial populations. Students will engage in interactive activities, including drawing population graphs and analyzing human growth patterns. The class will also cover population limiting factors and conclude with graphing relationships between prey and predator species.

E N D
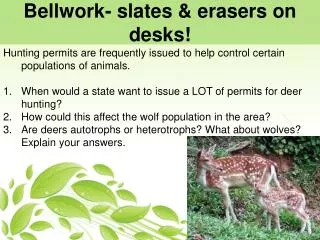
Hunting permits are frequently issued to help control certain populations of animals. When would a state want to issue a LOT of permits for deer hunting? How could this affect the wolf population in the area? Are deersautotrophs or heterotrophs? What about wolves? Explain your answers. Bellwork- slates & erasers on desks!
Announcements • Meet in M1 computer lab tomorrow for science fair proposals & research (take your 3 ring binder WITH YOU today!) • Science Café on MONDAY! Bring a snack for the class
Instructions for notes/participation When you see this pencil symbol next to something, you must write it in your notes When you see the marker, answer the question on your slate & wait for the guest teacher to ask everyone to show (No marker? Participate on scratch paper)
What would happen if bacteria could reproduce indefinitely? On a slate, draw what you think the population graph would look like Exponential Growth
What would happen if bacteria could reproduce indefinitely? Exponential Growth Draw a picture of an exponential growth graph in your notes
What would happen if bacteria could reproduce indefinitely? In just 36 hours a single E. coli bacteriumwould replicate enough times to cover the Earth in 1ft deep of its offspring So why aren’t we covered in bacteria?
What would happen if bacteria could reproduce indefinitely? In just 36 hours a single E. coli bacteriumwould replicate enough times to cover the Earth in 1ft deep of its offspring Limiting Factors! (Turn and tell your neighbor- what are the 4 limiting factors we discussed block day…) So why aren’t we covered in bacteria?
World Population = 7.0 billion Human Population Clock: http://galen.metapath.org/popclk.html What eventually happens to the graph?
World Population = 7.0 billion Human Population Clock: http://galen.metapath.org/popclk.html POPULATION CRASH!!!!
World Population = 7.0 billion Human Population Clock: http://galen.metapath.org/popclk.html Have we reached our carrying capacity, or have we overshot it? Explain why.
Human growth patterns At what ages do you see more females than males? 75-79 & 80+ What age group makes up the biggest % of Mexico’s population? Under 5 (5-9, & 15-19 are very close)
Human growth patterns Will Mexico’s population increase, decrease, or stay about the same? INCREASE
Human growth patterns Will Sweden’s population increase, decrease, or stay about the same? DECREASE
Human growth patterns Honey, I’m hooome! Will United State’s population increase, decrease, or stay about the same? What caused this bubble of middle-aged adults? INCREASE SLOWLY
Graph & Conclusion- due TODAY! • Graph how the population of jackrabbits vs coyotes change over time (think about what kind of graph this is…) • Conclusion paragraph (complete sentences, in lab book) • When finished turn the graph into front basket • **If time- work on the Critter: Ecology Outline to get a head start on your next critter project