Download
1 / 49
500 likes | 744 Views
Understanding Lake Erie and Its History. Dr . Jeffrey M. Reutter Director, Ohio Sea Grant College Program. One of the Most Important Lakes in the World. Dead lake image of 60s and 70s. Poster child for pollution problems in this country. But, most heavily utilized of any of the Great Lakes.

E N D
Understanding Lake Erie and Its History Dr. Jeffrey M. Reutter Director, Ohio Sea Grant College Program
One of the Most Important Lakes in the World Dead lake image of 60s and 70s. Poster child for pollution problems in this country. But, most heavily utilized of any of the Great Lakes. Shared by 4 states and 2 countries. Best example of ecosystem recovery in world.
Great Lakes Land Use Image: Ohio Sea Grant
Because of Land Use, Lake Erie Gets: More sediment More nutrients (fertilizers and sewage) More pesticides (The above 3 items are exacerbated by storms, which will be more frequent and severe due to climate change.) And Lake Erie is still biologically the most productive of the Great Lakes—And always will be!!
50:2 Rule (Not exact, but instructive) Lake Superior: 50% of the water and 2% of the fish Lake Erie: 2% of the water and 50% of the fish
80:10:10 Rule 80% of water from upper lakes 10% from Lake Erie tributaries 10% direct precipitation
Lake Erie Stats Drinking water for 11 million people Over 20 power plants Power production is greatest water use 300 marinas in Ohio alone Walleye Capital of the World 40% of all Great Lakes charter boats Ohio’s charter boat industry in largest in North America $1.5 billion sport fishery One of top 10 sport fishing locations in the world The most valuable freshwater commercial fishery in the world Coastal county tourism value is over $10 billion
Historical Trends:The Lake Erie Ecosystem 1969—Cuyahoga River burns Getting worse annually to 1970 Stable 1970-75 Improving 1975-1995 1995+ Getting worse Photo: Ohio Sea Grant
Lake Erie’s Biggest Problems/Issues Sedimentation Phosphorus and nutrient loading Harmful algal blooms Aquatic invasive species Dead Zone Climate Change—Makes the others worse Coastal Economic Development
Sedimentation Photo: NOAA Satellite Image
Nutrients: Nitrogen, Phosphorus, Potassium—N:P:K Stone Lab September 11, 2011 Photo: Jeff Reutter
Nutrients: Problem or Benefit? On our lawns, they make ourgrass grow In water, they make algae and plants grow Lake Erie is most productive Great Lake because: shallowest, warmest, and most nutrients. But it is possible to have too much of a good thing. Too much algae, wrong kinds of algae
Why does Lake Erie get most nutrients? The most agriculture in its basin Few forests Wetlands gone Large human population—water treatment, septic tanks, sewage treatment (or lack thereof)
What brought about the rebirth? Phosphorus reductions from point sources (29,000 metric tons to 11,000);and agriculture helped!
Why are we targeting phosphorus? Normally limiting nutrient in freshwater systems P reduction is best strategy ecologically and economically Reducing both P and N would help
Are we sure phosphorus reductions will solve the problem? It worked in the 70s and 80s and turned Lake Erie into the “Walleye Capital of the World” Approximately a 2/3 reduction in total P loading (29,000 tons to 11,000)
Blue-green Algae Bloom circa 1971, Lake Erie Photo: Forsythe and Reutter
Microcystis, Stone Lab, 8/10/10 Photos: Jeff Reutter
What Are We Doing To Address Lake Erie Problems Dr. Jeffrey M. Reutter Director, Ohio Sea Grant College Program
Actions • Research: OSU/Sea Grant/Stone Lab, UT Lake Erie Center, Heidelberg U. • Ohio Phosphorus Task Force • Report • Millennium Synthesis Team Funded by Ohio Lake Erie Commission and GLNPO • Report: 14 June 2011 • Reutter Presentations: IJC, USEPA, OEPA, ODNR, ODW, ODA, ODH, OSU Extension, NRCS Director, Ohio Legislature, Ohio Congressional Delegation, certified crop advisors, coastal mayors and county commissioners, sewage and water treatment plant operators, charter captains, tourism leaders, science writers, general public, National Sea Grant College Program, farmers, State Directors of Agriculture 13 states, TNC, OEC, Lake Erie LaMP, Joyce Foundation, Stone Lab students, and more • Agriculture Nutrients and Water Quality Work Group: ODA, OEPA, ODNR—Report to Governor Kasich • US Secretary of Agriculture Briefing, 16 March 2012
Lake Erie Millennium Network Synthesis Team • Interdisciplinary discussions were very valuable and beneficial to the report and individual team members. • Should try to keep the team together to address identified research needs and to aid managers in developing strategies to address the problem. • Jeff Reutter • Jan Ciborowski • Steve Davis • Joe DePinto • Darren Bade • David Baker • Tom Bridgeman • David Culver • Elizabeth Dayton • Doug Kane • Jack Kramer • Robert Mullen • Christopher Pennuto
Final Report: June 14, 2011 • Preliminary presentations for managers: February 10, 2010 and March 28, 2011 • 9 hours of conference calls since end of March • 10 pages of summary, findings, and implications • 23 Findings • 28 Implications • 18 research recommendations • An appendix with some items needing additional discussion
Phosphorus Sources • 1960s and 70s—primarily point sources (2/3) • Today loading is coming primarily from agriculture (2/3) but other sources include: • Sewage treatment plants and CSOs • Lawn fertilizer runoff • Water treatment plants • Septic tanks
Impacts of Increased Phosphorus Concentrations • HABs—If P concentrations are high (regardless of the source, Ag, sewage, etc.) and water is warm, we will have a HAB (nitrogen concentration will likely determine which of the 6-7 species bloom) • Nuisance Algae Blooms • Cladophora—Whole lake problem. An attached form. • Dead Zone in Central Basin
HAB Requirements Warm water (summer problem but now finding them in Maumee River as early as April) High phosphorus levels Zebra/quagga mussels (not required but remove competition)
Microcystin Concentrations 1 ppb WHO drinking water limit 20 ppb WHO swimming limit 60 ppb highest level for Lake Erie till this year 84 ppb highest level for Grand Lake St. Marys till last year 2000+ Grand Lake St. Marys 2010 1200 Lake Erie Maumee Bay area 2011
Are HABs only a Lake Erie and Ohio Problem? Global problem Serious problem in US and Canada Common species in Lake Erie is Microcystis sp. Dominant form in Grand Lake St. Marysin 2010 was Aphanizomenon sp., the same species that bloomed in Lake Erie in the 60s and 70s
Target Load Reduction To solve the harmful algal bloom problem (HAB) and reduce the size and duration of the dead zone in the Central Basin of Lake Erie, the overall annual load of soluble reactive or dissolved phosphorus to Lake Erie should be reduced by 2/3. All sources should reduce by 2/3!!
Nutrient Loading Majority of loading occurs during storm events 90% of loading occurs 10% of time
August 11 2011 1330 cfs Photo: NOAA Satellite Image
October 9, 2011 Photo: NOAA Satellite Image
Microcystis near Marblehead October 9, 2011 Photo: Richard Kraus, United States Geological Survey
HABs:Western Basin Problembut Contribute to Oxygen Demand inthe Central Basin, i.e.the Dead Zone
Lake Erie Cross Section Image: Ohio Sea Grant
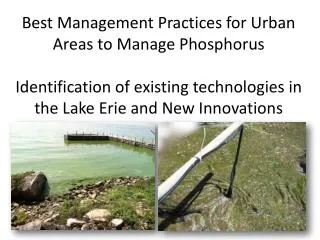
Possible Agriculture Action Areas • Eliminate fall and winter application of fertilizer and manure. • Eliminate broadcast application and incorporate the fertilizer into soil. • Soil testing of all fields to determine if we are missing some real problem spots and to prevent application of too much. • Do not apply P at levels above agronomic needs recommended by OSU. • Use appropriate fertilizer, e.g., don’t apply nitrogen in fall/winter • Do not apply fertilizer when rain is forecast to occur within 48 hours. • Place a moratorium on the addition of more tiles to remove water from agricultural fields. It appears that over 50% of the dissolved phosphorus leaving fields is going through the tiles—POINT SOURCES • Consider reducing the size of farms falling under CAFO regulations so more of the unregulated operations are regulated. • Improve recommendations made by soil testing laboratories regarding amount of P to be added (30% of Ohio fields have too much P already)
What other levers can we turn? • Lawn Care Recommendations • Encourage Scott's and all lawn care fertilizer sellers and their applicators to meet the zero P goal set by Scott's on 1 January 2012 rather than 1 January 2013. • Sewage Treatment Plant Recommendations • Cut allowable discharge levels of P in half. • Expedite actions to eliminate CSOs. • Water Treatment Plant Recommendations • Water treatment plant operators should stop using ortho-P as a corrosion reduction strategy. • Septic Tanks • Assure that all septic tanks are connected and working properly.
Zebra Mussel vsQuagga Mussel Photo: Ohio Sea Grant
Climate change is making these problems worse! • Warm water favors HABs • Warm water increases oxygen depletion rates • More severe storms will resuspend more sediment and increase erosion and nutrient loading • Critically important point—with no changes in Ag practices, warmer weather and increased frequency of severe storms could increase negative impact of existing practices. • Lake levels—uncertain/probably down
Maumee Storm Runoff Statistics (1960-2010) • Statistically significant increases: • Number of storm runoff events per year (67% increase) • Number of spring runoff events (40%) • Number of winter runoff events (47%) • Annual storm discharge (53%) • Summer storm discharge (27%) • Other seasonal comparisons show increases but they are not significant • Rapid increases 1960-1970, slower increases since Source: Dr. Peter Richards, Heidelberg University
Expected Time for Recovery Because Lake Erie is the smallest of the Great Lakes by volume, the retention time for water in the Lake is very short compared to the other 4 lakes—Western Basin retention time is 20-50 days. Therefore, if reduced loading targets are reached, recovery will be almost immediate.
For more information:Dr. Jeff Reutter, Director Ohio Sea Grant and Stone Lab Ohio State Univ. 1314 Kinnear Rd. Col, OH 43212 614-292-8949 Reutter.1@osu.edu ohioseagrant.osu.edu Stone Laboratory Ohio State Univ. Box 119 Put-in-Bay, OH 43456 614-247-6500
What Can You Do? • Donate to Friends of Stone Lab and Ohio Sea Grant • Make your voice heard • Reduce you own P contribution • Reduce water and energy consumption • Reduce runoff from your property • Me—2 rain barrels and 3 low-flow toilets • Stone Lab—low-flow toilets, shower heads, solar power, solar thermal hot water, high efficiency furnace, better insulation, new windows