Download
1 / 29
290 likes | 384 Views
Investigating the correlation between lightning strike density and terrain elevation using ArcGIS software. Data conversion, density calculations, and statistical analysis are conducted for SE Pennsylvania region. Future study to analyze data over Rio Grande Valley.

E N D
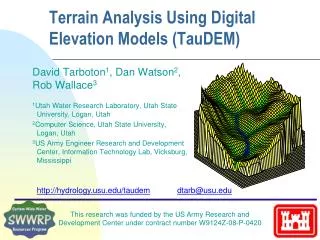
Using ArcGIS to Study the Correlation betweenLightning Strike Density and Terrain Elevation Alex DeCaria and Michael Babij Department of Earth Sciences Millersville University
Raster data Gridded data Attributes are assumed valid over entire cell ArcGIS stores in GRID files Vector data Uses points, lines, and polygons Attributes are assumed valid only on the given shape ArcGIS stores in shape files Raster vs. Vector
Lightning Data • Lightning strike positions for 1995-2001 acquired from the National Lightning Detection NetworkTM (NLDN) • NLDN detects only cloud-to-ground lightning • Positions are lat/lon on WGS84 datum • Positions are accurate to within 1 km
Formatting Data • Data came as ASCII file with each record representing a single lightning strike. • Lat/lon • Time • Signal (+ or ) • Wrote Fortran90 program to parse data into separate years and specific location. • Data files then read into Microsoft Access database program and converted into ArcGIS shape files (one for each calendar year)
Calculating Density • First converted data from lat/lon coordinates to meters easting and northing • Spatial Analyst then used to calculate density. • The density calculation creates a raster from the vector (point) lightning locations • Need to specify search radius and cell size.
How ArcGIS* Calculates Density r = search radius d = cell size * Need Spatial Analyst extension
Effect of Search Radius on Density Calculations Radius = cell size Radius >> cell size
Calculating Density • First converted data from lat/lon coordinates to meters easting and northing • Spatial Analyst then used to calculate density. • The density calculation creates a raster from the vector (point) lightning locations • Need to specify search radius and cell size. • Need to specify “simple” or “kernal” for calculations
“Simple” vs. “Kernal” for Density Calculations Simple Kernal
Calculating Density (cont.) • Density data are adjusted based on estimated detection efficiencies • Efficiency was 61% in 1995 and increased to 100% in 1998 and later • Adjusted yearly densities were averaged to calculate annual average flash density map
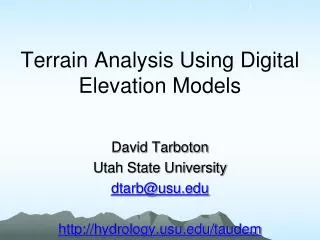
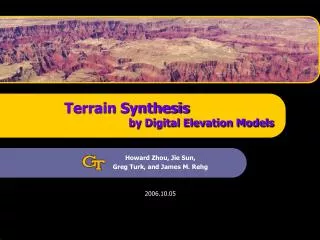
Elevation Data • Used USGS National Elevation Data set (~30-meter horizontal grid). • Converted to 1-km horizontal grid using Raster Calculator feature of Spatial Analyst extension
Joining Density and Elevation Data • Used Raster Calculator to re-map density and elevation data sets onto their shared domain.
Creating Joined Elevation/Density Data File • Converted both the elevation and density data sets into vector (point) format using the “convert” feature of Spatial Analyst. • ArcGIS only converts integer rasters to vector form. • Used Raster Calculator to convert real raster to integer raster • Needed to multiply density by 10 to preserve information in decimal place.
Creating Joined Elevation/Density Data File (cont.) • Joined the two vector data sets using the “Join” feature of Spatial Analyst. • This creates a joined “attribute table” that contains both density and elevation information at each point.
Statistical Analysis • Exported joined attribute table to ASCII file and then imported it into a Microsoft Excel worksheet. • Used Microsoft Excel to create scatter plot and perform linear regression.
Conclusions • There exists a weak, yet statistically significant negative correlation between terrain elevation and annual average lightning strike density for SE Pennsylvania. • Suggests that orography is not the dominant factor in thunderstorm formation in this region. • Consistent with Orville and Huffines (2001)* • Next step: Analyze data over Rio Grande Valley in New Mexico, where there appears to be a positive correlation between flash density and elevation. * Orville, R.E. and G.R. Huffines, 2001: “Cloud-to-ground lightning in the United States: NLDN results in the first decade, 1989-98, Mon. Wea. Rev., 129, pp. 1179-1193
Acknowledgements • Ken Cummins, Väisälä-GAI, Inc. • Provided lightning position data free of charge. • Millersville University Faculty Grants Committee • Funded student research hours. • Tom Whitfield, PA Geological and Topographic Survey • Provided topographic data and advice.