Download
1 / 19
190 likes | 299 Views
Confidence intervals and bivariate regression The limits of significance. What is the probability that the Red Sox will hit 1, 2, 3, 4, 5, OR 6 or more homeruns in a game?. A. 0 B. 300 C. 1 D. 50%. What is the probability that the Red Sox will hit 1.38 or more homeruns in a game?. A. 0

E N D
Confidence intervals and bivariate regression The limits of significance
What is the probability that the Red Sox will hit 1, 2, 3, 4, 5, OR 6 or more homeruns in a game? • A. 0 • B. 300 • C. 1 • D. 50%
What is the probability that the Red Sox will hit 1.38 or more homeruns in a game? • A. 0 • B. 300 • C. 1 • D. 50%
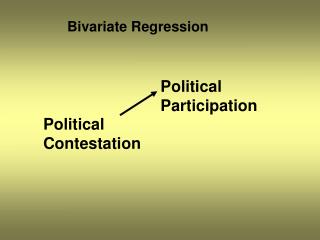
Bivariate regression • Theory • Spurious relationships • Support for affirmative action and support for bilingual education
Confidence • Confidence • A function of three things: • The slope • The error around the slope • The number of observations
Confidence Intervals Quantifying uncertainty
1. A 95% confidence interval is… • A. 95 % sure that the mean is a particular number. • B. 95% sure that the sample mean is the population mean • C. about 2 standard deviations above and below the mean • D. 95 % sure that the mean lies between two numbers
1. If the sample mean is .45 and the standard deviation is .03, then the confidence interval is… • A. There is no way to be sure because we can never know the population. • B. The confidence interval is 15% - 75%. • C. The confidence interval is 39%-51% • D. The confidence interval is 42% - 48%.
1. The margin of error is … • A. Question wording. • B. estimated standard deviation of the sampling distribution • C. When pollsters report the wrong marginals. • D. when polls are accurate, they don’t have a margin of error
1. A 95% confidence interval is … than a 90% confidence interval • A. There is no such thing as a 90% confidence interval • B. less precise than • C. more precise than • D. not as good as a 100 % confidence interval
Confidence depends on differences Assume a 3% margin of error. Which candidate is winning? A B
Confidence intervals about relationships • We talk about rejecting the null hypothesis with 95% confidence, or only 90% confidence, or 99.9% confidence
Confidence intervals are also partially a function of the standard deviation of the sample • – the higher the variation, the lower the confidence
Null Hypothesis Rejecting the null hypothesis is saying that you tried to prove your hypothesis wrong, but were unable to prove it wrong This does not mean we have proved it with 95% confidence, or proved it at all
Bivariate regression and confidence intervals polpartbe~nt | Coef. Std. Err. t P>|t| [95% Conf. Interval] -------------+---------------------------------------------------------------- gltfed | -.0521169 .1098888 -0.47 0.635 -.2675452 .1633115 _cons | 2.587292 .3884794 6.66 0.000 1.825708 3.348876 ------------------------------------------------------------------------------ Federal | authorities - how | guilty for | causing the | tragedy in the | school | Freq. Percent Cum. ------------------+----------------------------------- Not at all guilty | 19 0.36 0.36 Not very guilty | 261 4.89 5.24 Somewhat guilty | 2,190 41.01 46.25 Very guilty | 2,870 53.75 100.00 ------------------+----------------------------------- Total | 5,340 100.00
Bivariate regression and confidence intervals polpartbe~nt | Coef. Std. Err. t P>|t| [95% Conf. Interval] -------------+---------------------------------------------------------------- solvposs | 1.198754 .0641282 18.69 0.000 1.073036 1.324472 _cons | -.8106842 .1837442 -4.41 0.000 -1.170899 -.4504688. tab solvposs How possible is it | to solve these | problems | Freq. Percent Cum. --------------------+----------------------------------- Not at all possible | 729 13.52 13.52 Not very possible | 1,608 29.82 43.33 Rather possible | 1,645 30.50 73.84 Very possible | 1,411 26.16 100.00 --------------------+----------------------------------- Total | 5,393 100.00