Download
1 / 6
70 likes | 274 Views
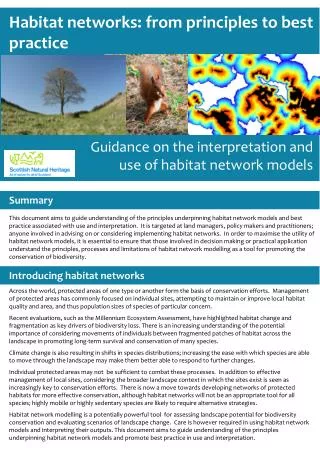
Habitat networks: from principles to best practice. Summary.

E N D
Habitat networks: from principles to best practice Summary This document aims to guide understanding of the principles underpinning habitat network models and best practice associated with use and interpretation. It is targeted at land managers, policy makers and practitioners; anyone involved in advising on or considering implementing habitat networks. In order to maximise the utility of habitat network models, it is essential to ensure that those involved in decision making or practical application understand the principles, processes and limitations of habitat network modelling as a tool for promoting the conservation of biodiversity. Guidance on the interpretation and use of habitat network models Introducing habitat networks Across the world, protected areas of one type or another form the basis of conservation efforts. Management of protected areas has commonly focused on individual sites, attempting to maintain or improve local habitat quality and area, and thus population sizes of species of particular concern. Recent evaluations, such as the Millennium Ecosystem Assessment, have highlighted habitat change and fragmentation as key drivers of biodiversity loss. There is an increasing understanding of the potential importance of considering movements of individuals between fragmented patches of habitat across the landscape in promoting long-term survival and conservation of many species. Climate change is also resulting in shifts in species distributions; increasing the ease with which species are able to move through the landscape may make them better able to respond to further changes. Individual protected areas may not be sufficient to combat these processes. In addition to effective management of local sites, considering the broader landscape context in which the sites exist is seen as increasingly key to conservation efforts. There is now a move towards developing networks of protected habitats for more effective conservation, although habitat networks will not be an appropriate tool for all species; highly mobile or highly sedentary species are likely to require alternative strategies. Habitat network modelling is a potentially powerful tool for assessing landscape potential for biodiversity conservation and evaluating scenarios of landscape change. Care is however required in using habitat network models and interpreting their outputs. This document aims to guide understanding of the principles underpinning habitat network models and promote best practice in use and interpretation.
2 INCREASING EASE OF MOVEMENT THROUGH LAND-USE TYPE COST OF MOVEMENT 4 8 HIGH COST PATH (TOTAL COST = 16) LOW DISTANCE MOVED LOW COST PATH (TOTAL COST = 16) HIGH DISTANCE MOVED Assessing habitats as networks The extent to which individual patches of habitat are ‘connected’ in a larger network can be assessed in different ways. NOT STRUCTURALLY CONNECTED STRUCTURALLY CONNECTED Structural connectivity emphasises actual physical connections between habitat patches (shown in blue). If patches are not physically linked, then they are not considered to be connected Functional connectivity considers the extent to which the land between habitat patches allows or restricts movement. This is commonly termed landscape ‘permeability’. A highly permeable land-use is easier for a species to cross than a less permeable one. If the land-use between patches allows individuals to travel over the distance between them then they are considered to be functionally connected. IMPERMEABLE LAND-USE PERMEABLE LAND-USE MOVEMENT THROUGH INTERVENING LAND-USE POSSIBLE. PATCHES ARE FUNCTIONALLY CONNECTED MOVEMENT THROUGH INTERVENING LAND-USE DIFFICULT, SO PATCHES ARE NOT FUNCTIONALLY CONNECTED Methods for assessing habitat networks Almost all methods of assessing habitat networks consider functional connectivity, but they do so in a variety of ways. Different models share some common parameters (definition of habitat patches, estimate of dispersal distances, landscape permeability modifying dispersal), but networks defined by the different models will vary in their characteristics. Most UK habitat networks are currently based on least-cost models, so these will form the focus of guidance, but many other alternatives exist, and will give different resultant networks Least-cost models: these use information on landscape permeability to determine the ‘cost’ to an organism of travelling along a given path through the landscape. Higher cost land-uses (lower permeability) reduce the overall distance that can be travelled. For example, if a species is capable of dispersing a maximum of 16 distance units through a landscape with a cost per unit travel of 1, then in a landscape with a cost per unit travel of 4 it will only be able to travel 16/4 = 4 units. This is known as the cost-distance (see example on right) Least-cost habitat networks are defined by areas where land-use permeability allows movement between patches of habitat i.e. the total cost-distance to travel between patches is less than the maximum distance that a species can travel. This example shows two alternative paths through a landscape. They have the same total cost, but the distance travelled is very different due to the differing cost of the land-uses travelled through.
Box 1: The Delphi process in a nutshell A panel of experts (ideally at least 10) provide estimates of parameters (e.g. dispersal distances), along with their reasoning. Smaller numbers of experts are acceptable, but may underestimate uncertainty in parameters. Responses are summarised anonymously by a facilitator and returned to the experts. The experts are asked to consider their initial estimates in the light of the other responses and resubmit new estimates. The process is repeated two or three times until the responses converge to a common answer, or a range deemed sufficiently narrow to proceed. Data requirements for habitat networks Habitat network models are derived from sound ecological principles, but the empirical data required only exists for very few species. All habitat network modelling methods are sensitive to the data which is used to derive outputs. The data requirements, implications of shortcomings and relative extent of the evidence base are explored below for the different data necessary to derive a habitat network. Data requirements Land-use information Required to define habitat patches and assess effects of landscape on connectivity. Data is increasingly available, but variable in quality and resolution. Habitat preferences Needed to define what constitutes a habitat patch. Often based on a subset of land-use data (see above). Can also include minimum area requirements. Dispersal distances Defines maximum distance between patches to establish connectivity. Very limited quantitative information for most species nnnnnnnnnnnnnnnnnnnnnn hhhhhhhhhhhhhhhhhhhhhh hh Landscape permeability Needed to estimate effects of land-use on dispersal via cost-distance. Empirical data almost non-existent. Implications of uncertainty Land-use information Range of land-use types included and resolution affects the configuration and precision of networks produced. vvvvvvvvvvvvvv Inclusion of areas which do not function as habitat will tend to overestimate habitat area and thus the extent of habitat networks. Over- or under-estimation of dispersal distances will affect the extent to which patches are seen to be functionally connected and the size of the habitat network. Nnnnnnnnnnnnnnnnnnnnn Affects cost-distance estimates, so strongly modifies the extent of connectivity between patches Extent of information (more bars = more information) What do we know? Habitat preferences Inclusion of low permeability land-uses such as roads is particularly important. Relatively low resolution of most data makes broad-scale analysis most robust. Dispersal distances The level of habitat specialisation varies between species. The most robust networks are likely to be those derived for generalist species. hjhjhjhhjh Land-use information Species with moderate to high dispersal abilities are likely to benefit most from habitat network approaches. Sedentary species may be best served by alternative approaches. Data is increasingly available Relative extent of different networks appears to be robust, providing rank order of permeability values is correct. Data deficiencies: How best to proceed? In the absence of adequate data for all but the best studied species, pragmatic approaches have to be utilised in order to proceed with habitat network modelling. These have implications for the interpretation of the resultant networks. Use of expert opinion Where empirical or literature data for habitat network modelling is lacking, expert opinion is widely used. It is recommended that expert opinion is incorporated into network analyses through a Delphi process (Box 1). The normal aim of a Delphi process is to reach a reasoned consensus, but given the potential uncertainty inherent in parameters derived in this manner, the range of values which are submitted may be more valid for use as parameters, allowing a range of scenarios to be derived which can then be evaluated (see Multiple maps section, overleaf).
Habitat Minimum network Maximum network Data deficiencies: How best to proceed? Focal Species: Real or Generic? In habitat network modelling, a focal species is one which forms the basis of the parameters used to derive a network. Information gained from literature or expert opinion can be used to define the requirements of the species and derive a network specific to this species. Examples of focal species data are given below. For sources of information see Further reading at the end. Rather than base networks on actual species, so-called Generic Focal Species or GFS are commonly used within habitat network modelling. This overcomes the problems of lack of data, and is also more relevant to situations where multiple species are the targets for conservation. GFS profiles are drawn from expert opinion to represent a range of species within a particular habitat, for example species with intermediate dispersal of broad-leafed woodland. Examples of GFS profiles used in previous habitat network analyses are shown below. Multiple maps Whether habitat network modelling is based on real or generic focal species, there is real uncertainty in most parameters and a series of maps should be produced to indicate the sensitivity of network configuration to parameter uncertainty (Box 2). Where there is little variation between the networks produced by different parameter combinations we should have greater confidence that the networks are robust. Box 2: Example of variation between networks based on different parameter ranges Habitat networks derived for a broad-leaved woodland specialist species. Permeability values were obtained from a Delphi analysis (reference 1). Networks illustrated are for 2km dispersal and maximum permeability and 500m dispersal and minimum permeability, representing two extremes of a range of possibilities. Similarities between the location and size of networks derived from different parameter combinations give some indication of how confident we should be in the mapped networks despite inherent uncertainties in the data. Little variation: network robust Greater variation: lower confidence
Existing habitat network Network from increasing woodland area Network from deintensification of arable land How can we use habitat network models? The following section is aimed to give an overview of some common questions that have and may be addressed using habitat network models, the extent to which we can be confident in the output produced in different circumstances and any specific issues that should be considered. It is not intended to be exhaustive, rather as an indicative list which can be used to guide potential users. Box 3: Example of use of habitat networks in land-use change scenario planning Moseley et al. (reference 2) developed habitat networks for a different GFS profiles in the Falkirk area as part of Scotland-wide analyses. Here the woodland generalist GFS profile is used to illustrate two alternative scenarios of land management on network configuration for land to the NW of Larbert a) existing habitat network, b) increasing the size of existing woodland areas by 20% and c) deintensification of the same area of arable land, making intervening land more permeable. a b c
Summary of key points and recommendations • Habitat network models are a potentially powerful tool for contributing to the conservation of biodiversity, but not all species are equally suited to the modelling process • Least-cost habitat network models are currently the most widely used method, but a rapidly increasing range of habitat network models are becoming available which will give different outputs • All habitat network models require data on land-use, habitat preferences, dispersal distances and landscape permeability • Most of these data are not available for the vast majority of species, leading to the need to use Generic Focal Species to capture broad groups of similar species • Expert opinion is frequently used to provide estimates of required data, and this should be obtained through a Delphi process wherever possible • Outputs from habitat network models should reflect the inherent uncertainty in parameters by representing a range of possible networks based on maximum and minimum input values • The results of a habitat network modelling exercise should not be used as the sole basis for land-use planning decisions; they show indicative areas rather than definite boundaries References and Further Reading References 1. Watts, K., Handley, P., Scholefield, P. & Norton, L. (2008) Habitat Connectivity – Developing an indicator for UK and country level reporting. Final report for DEFRA Research Contract CR0388. Available from: http://randd.defra.gov.uk/ 2. Moseley, D., Smith, M., Chetcuti, J. & de Ioanni, M (2008) Falkirk Integrated Habitat Networks. Contract report to Falkirk Council, Forestry Commission Scotland, Scottish Natural Heritage, and Central Scotland Forest Trust. http://www.forestry.gov.uk/fr/INFD-7S9BA4 Further Reading Habitat Networks – reviewing the evidence base. Research Report associated with current advice document (contains more details and information on sources referred to in the text. Search for title at: http://www.snh.gov.uk/publications-data-and-research/ Principles of Habitat Network Modelling: Watts, K., Humphrey, J.W., Griffiths, M., Quine, C. & Ray. D (2005) Evaluating Biodiversity in Fragmented Landscapes: Principles. Forestry Commission Information Note No. 73. http://www.forestresearch.gov.uk/pdf/fcin073.pdf/$FILE/fcin073.pdf Use of Focal Species in Habitat Network Modelling: Eycott, A., Watts, K., Moseley, D. & Ray, D. (2007) Evaluating Biodiversity in Fragmented Landscapes: The Use of Focal Species. Forestry Commission Information Note No. 73. http://www.forestresearch.gov.uk/pdf/fcin089.pdf/$FILE/fcin089.pdf Guidance on Developing Native Woodland Habitat Networks. http://www.forestry.gov.uk/pdf/fcshabitatnetworkguidance.pdf/$FILE/fcshabitatnetworkguidance.pdf Example of habitat network based approach to conservation: the RSPB Futurescapes Initiative. http://www.rspb.org.uk/futurescapes/ Acknowledgements Habitat network maps shown are based on Land Cover Map 2000 data licensed by SNH from the Centre for Ecology and Hydrology and Ordnance Survey Mapping (© Crown Copyright and database right 2010). The guidance was written by Rob Briers, Edinburgh Napier University for Scottish Natural Heritage. Cover photos: Tree in landscape © Gonzobrum, squirrel © Anatoly Tiplyashin | Dreamstime.com