1 / 2
20 likes | 73 Views
Get this template plus 350 other premium business tools & templates at www.demandmetric.com

E N D
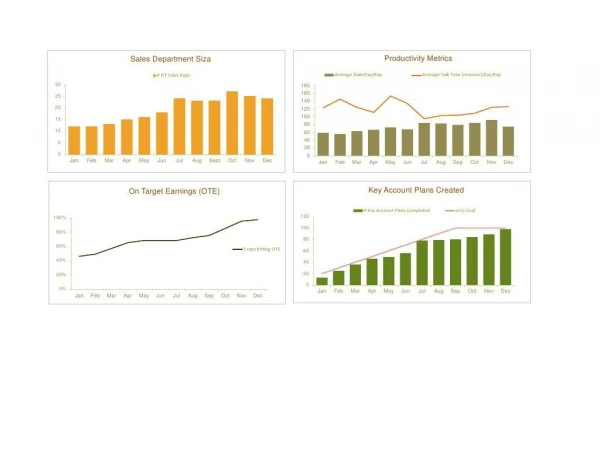
Sales Operations Metrics Dashboard Sales Department Siza Productivity Metrics # F/T Sales Reps Average Dials/Day/Rep Average Talk Time (minutes)/Day/Rep30 180 16025 14020 12015 100 8010 60 5 40 20 0 0 Jan Feb Mar Apr May Jun Jul Aug Sept Oct Nov Dec Jan Feb Mar Apr May Jun Jul Aug Sep Oct Nov Dec On Target Earnings (OTE) Key Account Plans Created # Key Account Plans Completed 2013 Goal100% 120 10080% 8060% % reps hitting OTE 6040% 4020% 20 0 0% Jan Feb Mar Apr May Jun Jul Aug Sep Oct Nov Dec Jan Feb Mar Apr May Jun Jul Aug Sep Oct Nov Dec
Dashboard Data InputSales Operations Metrics Q1 Q2 Q3 Q4Size of Department Jan Feb Mar Apr May Jun Jul Aug Sept Oct Nov Dec # F/T Sales Reps 12 12 13 15 16 18 24 23 23 27 25 24Productivity Metrics Jan Feb Mar Apr May Jun Jul Aug Sep Oct Nov Dec Average Dials/Day/Rep 59 56 63 67 73 68 84 83 79 84 92 75 Average Talk Time (minutes)/Day/Rep 123 145 124 111 153 134 95 103 104 109 124 126Key Account Plans Created Jan Feb Mar Apr May Jun Jul Aug Sep Oct Nov Dec # Key Account Plans Completed 13 25 36 46 49 56 78 79 80 84 89 98 2013 Goal 20 30 40 50 60 70 80 90 100 100 100 100On Target Earnings (OTE) Jan Feb Mar Apr May Jun Jul Aug Sep Oct Nov Dec % reps hitting OTE 46.0% 49.0% 57.0% 65.0% 68.0% 68.0% 68.0% 72.0% 75.0% 85.0% 95.0% 97.0% Dashboard Data InputSales Operations Metrics Q1 Q2 Q3 Q4Size of Department Jan Feb Mar Apr May Jun Jul Aug Sept Oct Nov Dec # F/T Sales Reps 12 12 13 15 16 18 24 23 23 27 25 24Productivity Metrics Jan Feb Mar Apr May Jun Jul Aug Sep Oct Nov Dec Average Dials/Day/Rep 59 56 63 67 73 68 84 83 79 84 92 75 Average Talk Time (minutes)/Day/Rep 123 145 124 111 153 134 95 103 104 109 124 126Key Account Plans Created Jan Feb Mar Apr May Jun Jul Aug Sep Oct Nov Dec # Key Account Plans Completed 13 25 36 46 49 56 78 79 80 84 89 98 2013 Goal 20 30 40 50 60 70 80 90 100 100 100 100On Target Earnings (OTE) Jan Feb Mar Apr May Jun Jul Aug Sep Oct Nov Dec % reps hitting OTE 46.0% 49.0% 57.0% 65.0% 68.0% 68.0% 68.0% 72.0% 75.0% 85.0% 95.0% 97.0%