Download
1 / 7
70 likes | 93 Views
How influential is sales and marketing alignment on achieving revenue goals? A Demand Metric Benchmark Study concluded that sales and marketing alignment is more than just “happy talk”; it has a real effect on revenue performance. In June 2013, Demand Metric conducted a benchmarking study to assess the influences on sales and marketing alignment and how in turn in impacts revenue performance. Key findings from this study include: • Not an “all or nothing” proposition: complete alignment of sales and marketing goals is related to the highest revenue achievement, but even partial alignment is far superior to none. • Rose-colored glasses: Presidents, CEOs or owners of their firms are more likely to perceive strong or complete sales and marketing alignment than their sales and marketing teams. • Two is better than one: Organizational structure is related to achievement. Separate sales and marketing teams outperform organizations where sales and marketing operate as a single, combined team. • The one with the best tools wins: Mature implementations of sales and marketing systems, such as marketing automation or CRM, are having a significant impact on revenue achievement. • Integration = Revenue: The highest level of revenue achievement coincides with the highest level of integration effectiveness between sales and marketing systems. • Diminishing returns: once qualified leads account for 10% of total leads generated, revenue achievement remains flat even as the percentage of qualified leads increases. Learn more about the impact of sales and marketing alignment on revenue performance by downloading a copy of the report. Table of Contents 1. Introduction 2. Executive Summary 3. Research Methodology 4. Revenue Goal Acheivement 5. Perception of Alignment 6. Organizational Structure 7. Alignment & Technology 8. Leads & Lead Quality 9. Analyst Bottom Line 10. Acknowledgements 11. About Demand Metric Research Methodology The Demand Metric 2013 Sales & Marketing Alignment Survey was administered online over a period of June 24th through June 30th, 2013. During that time, over 600 responses were collected, 550 of which were complete. All members of the Demand Metric community received email invitations to participate in the survey, and participation was encouraged through a random draw incentive for an iPad Mini. While respondent email addresses were collected in order to facilitate the prize drawing, no identifying information was retained or considered in the analysis of the survey data. Following collection of the survey data, Demand Metric used IBM SPSS statistics software to analyze the results and draw statistically significant conclusions.

E N D
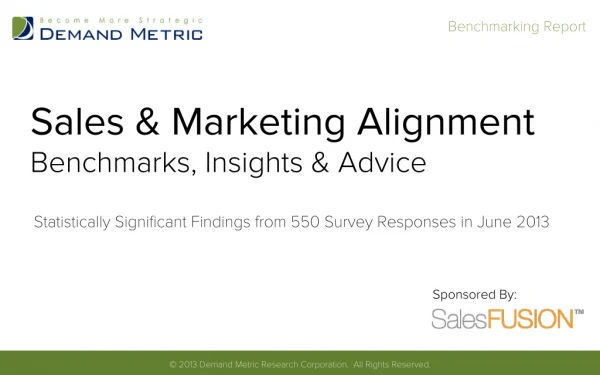
Benchmarking Report Sales & Marketing Alignment Benchmarks, Insights & Advice Statistically Significant Findings from 550 Survey Responses in June 2013 Sponsored By: © 2013 Demand Metric Research Corporation. All Rights Reserved.
TABLE OF CONTENTS Introduction Alignment & Technology 3 13 Executive Summary Leads & Lead Quality 4 17 Analyst Bottom Line 5 18 Research Methodology Acknowledgements 6 19 Revenue Goal Achievement Perception of Alignment About Demand Metric 8 20 Organizational Structure 10
INTRODUCTION It seems intuitive that aligning the sales and marketing functions in an organization makes good business sense. The assumption about well-aligned sales and marketing teams is that better alignment should produce better performance in terms of sales achievement. The goal of this study was to explore how the degree of alignment as measured across two dimensions – organizational structure and use of enabling technology – impacts revenue achievement. Alignment exists along a continuum, ranging from none to complete alignment. Since “alignment” has different interpretations, this study chose to focus on shared goals as the indicator of alignment: if the sales and marketing functions within an organization reported strong or complete harmony with respect to goals, a high degree of alignment existed. This level of alignment around goals implies that communication, understanding and mutual acceptance of goals exists, and quite probably that these goals were developed collaboratively. Thank you to all those who participated in the survey. We really appreciate your input! Jerry Rackley, Chief Analyst Demand Metric jerry@demandmetric.com | + 1 (405) 213 0050 3
EXECUTIVE SUMMARY A survey was used to collect the data for this study, and its analysis provides these key findings: • Complete alignment of sales and marketing goals is related to the highest revenue achievement, but even partial alignment is far superior to no alignment. • Presidents, CEOs or owners of their firms are more likely to perceive strong or complete alignment of sales and marketing goals when compared to their sales and marketing teams. • The structure of the sales and marketing teams is related to achievement. Those organizations that maintain separate sales and marketing teams, regardless of whether those teams report to the same or different managers, outperform organizations where sales and marketing operate as a single, combined team. • Implementations of marketing technology, such as marketing automation systems, that are mature enough to deliver most or all of the promised benefits are having a significant impact on revenue achievement. • Mature implementations of sales technology, such as CRM, are also making an impact on revenue achievement. No respondents who reported receiving the full benefits of sales technology missed their revenue achievement goals. • The highest level of revenue achievement occurs at the highest level of integration effectiveness between sales and marketing systems. Sales and marketing systems that are highly integrated provide a distinct advantage when it comes to revenue achievement. • There is a point of diminishing returns when it comes to lead quality as it relates to revenue achievement. The study reveals a 10 percent tipping point of qualified leads, beyond which revenue achievement does not improve as the percentage of qualified leads increases.
EXECUTIVE SUMMARY - CONTINUED Following are some of the key statistics that this research study uncovered: § 66% of organizations reporting complete alignment achieved their revenue goals compared to 41% who reported no alignment. § 72% of top executives perceive strong or complete alignment, but only 51% of marketing teams see it this way. § 31% of organizations report using the least effective organizational structure. § 89% or more of the firms who report getting most or all the benefits from their marketing systems achieved their revenue goals. § 100% of respondents that reported getting all the benefits of their sales systems achieved their revenue goals. § 80% of respondents who said their sales and marketing systems are highly integrated achieved their revenue goals, while only 36% of those who report no integration made theirs. § Once the ratio of qualified leads to total leads exceeds 10%, revenue achievement performance remains flat.
RESEARCH METHODOLOGY Demand Metric’s 2013 Sales & Marketing Alignment Survey was administered online from June 24th through June 30th, 2013. During this period, over 600 responses were collected, 550 of which were complete and not duplicates and were therefore included in the analysis. All members of the Demand Metric community received email invitations to participate in the survey, and participation was encouraged through a random draw incentive for an iPad Mini. While respondent email addresses were collected in order to facilitate the prize drawing, no identifying information was retained or considered in the analysis of the survey data. Summarized below is the basic information that was collected about survey respondents to enable filtering and analysis of data: Number of Employees: § Zero to 25 (31%) § 26 to 100 (18%) § 101 to 250 (11%) § 251 to 1,000 (16%) § 1,001 to 10,000 (15%) § Over 10,000 (9%) Type of Organization: § B2B (66%) § B2C (14%) § B2B/B2C (20%) $501 to $1 Billion (7%) Over $1 Billion (13%) 5 Primary Job Role of Respondent: President, CEO or Owner (20%) Marketing (58%) Sales (7%) Information Technology (4%) Other (11%) Annual Revenue: Less than $10 Million (42%) $11 to $25 Million (14%) $26 to $100 Million (15%) $101 to $500 Million (10%) Success with Revenue Achievement Goals for Most Recently Completed Fiscal Year: Fell Far Short of Goals (15%) Just Missed Achieving Goals (23%) Achieved Goals (43%) Exceeded Goals (17%) Far Exceeded Goals (3%)
Benchmarking Report To read the full report, download it from: http://www.demandmetric.com/content/sales-marketing-alignment-benchmark-report Demand Metric Research Corporation #300 – 1275 West 6th Avenue, Vancouver, BC CANADA V6H 1A6 © 2013 Demand Metric Research Corporation. All Rights Reserved. © 2013 Demand Metric Research Corporation. All Rights Reserved.