1 / 6
60 likes | 82 Views
Get this template plus 350 other premium business tools & templates at www.demandmetric.com

E N D
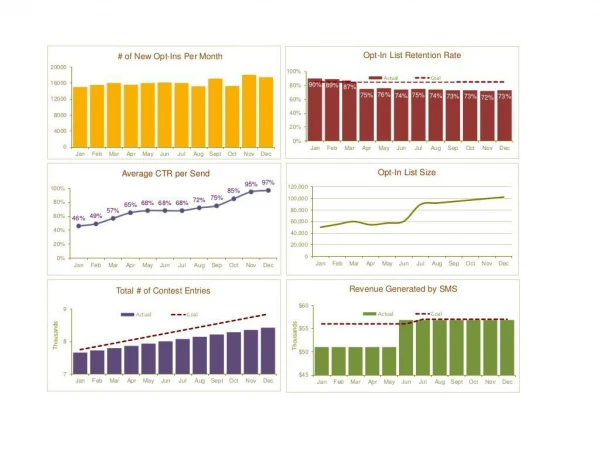
Mobile Marketing Metrics Dashboard # of New Opt-Ins Per Month Opt-In List Retention Rate20000 100% Actual Goal16000 80% 90% 89% 87% 75% 76% 74% 75% 74% 73% 73% 72% 73%12000 60%8000 40% 20%4000 0% 0 Jan Feb Mar Apr May Jun Jul Aug Sep Oct Nov Dec Jan Feb Mar Apr May Jun Jul Aug Sept Oct Nov Dec Average CTR per Send Opt-In List Size 95% 97% 120,000100% 85%80% 72% 75% 100,000 65% 68% 68% 68% 57% 80,00060% 46% 49% 60,00040% 40,00020% 20,000 0% 0 Jan Feb Mar Apr May Jun Jul Aug Sep Oct Nov Dec Jan Feb Mar Apr May Jun Jul Aug Sep Oct Nov Dec Total # of Contest Entries Revenue Generated by SMS $60 9 Actual Goal Actual GoalThousands Thousands $55 8 $50 7 $45 Jan Feb Mar Apr May Jun Jul Aug Sept Oct Nov Dec Jan Feb Mar Apr May Jun Jul Aug Sept Oct Nov Dec
Clicks by Mobile App Ad Location Revenue Generated by Rich Media Display Ads $800,0005000 Industry App Game App News App Association App Industry App 2 News App 2 $600,00040003000 $400,0002000 $200,0001000 $0 0 Jan Feb Mar Apr May Jun Jul Aug Sep Oct Nov Dec Jan Feb Mar Apr May Jun Jul Aug Sept Oct Nov Dec # of Display Ad Impressions % of Click to Call 25000 3% Actual Goal 2.4% 20000 2.2% 2.0% 2% 1.8% 15000 1.6% 1.4% 1.2% 10000 1.0% 1% 0.8% 0.6% 5000 0.4% 0.2% 0 0% Jan Feb Mar Apr May Jun Jul Aug Sep Oct Nov Dec Jan Feb Mar Apr May Jun Jul Aug Sep Oct Nov Dec % of Click to Web CTR by App Display Ad (A/B) 5% Display Ad… 7.3% 3.6% 3.4% 3.3% 3.2% Display Ad… 5.3% 2.7% 3% 2.5% 2.4% 2.4% Display Ad… 2.3% 2.0% 2.1% 1.9% 1.7% Display Ad… 2.5% 2% Display Ad… 3.6% Display Ad… 3.1% 0% Jan Feb Mar Apr May Jun Jul Aug Sep Oct Nov Dec 0% 2% 4% 6% 8% Clicks by Mobile App Ad Location Revenue Generated by Rich Media Display Ads $800,0005000 Industry App Game App News App Association App Industry App 2 News App 2 $600,00040003000 $400,0002000 $200,0001000 $0 0 Jan Feb Mar Apr May Jun Jul Aug Sep Oct Nov Dec Jan Feb Mar Apr May Jun Jul Aug Sept Oct Nov Dec # of Display Ad Impressions % of Click to Call 25000 3% Actual Goal 2.4% 20000 2.2% 2.0% 2% 1.8% 15000 1.6% 1.4% 1.2% 10000 1.0% 1% 0.8% 0.6% 5000 0.4% 0.2% 0 0% Jan Feb Mar Apr May Jun Jul Aug Sep Oct Nov Dec Jan Feb Mar Apr May Jun Jul Aug Sep Oct Nov Dec % of Click to Web CTR by App Display Ad (A/B) 5% Display Ad… 7.3% 3.6% 3.4% 3.3% 3.2% Display Ad… 5.3% 2.7% 3% 2.5% 2.4% 2.4% Display Ad… 2.3% 2.0% 2.1% 1.9% 1.7% Display Ad… 2.5% 2% Display Ad… 3.6% Display Ad… 3.1% 0% Jan Feb Mar Apr May Jun Jul Aug Sep Oct Nov Dec 0% 2% 4% 6% 8%
Total # Scans/Ad Location Total # of Scans (All Time) 50005000 Billboard Tradeshow Product Packaging In Store Display Magazine Ad Newspaper Ad 4500 # of Scans (Actual) # of Scans (Goal) 40004000 3500 30003000 25002000 2000 15001000 1000 500 0 0 Jan Feb Mar Apr May Jun Jul Aug Sept Oct Nov Dec Jan Feb Mar Apr May Jun Jul Aug Sept Oct Nov Dec Conversions from QR Landing Pages Total # of QR Code Impressions2000 1775 160,000 1531 1600 1459 1509 14981600 1400 1401 120,000 1200 1210 12501200 1000 80,000800 40,000400 0 0 Jan Feb Mar Apr May Jun Jul Aug Sep Oct Nov Dec Jan Feb Mar Apr May Jun Jul Aug Sept Oct Nov Dec Scan Through Rate(%) Conversions by Landing Page (A/B) 7% 2000 Actual Goal Landing Page #1 Landing Page #2 Landing Page #3 6% 5% 1500 4.1% 4.2% 3.7% 3.9% 3.6% 3.7% 3.9% 4% 3.2% 3.3% 3.1% 3.1% 1000 2.8% 3% 2% 500 1% 0% 0 Jan Feb Mar Apr May Jun Jul Aug Sept Oct Nov Dec Jan Feb Mar Apr May Jun Jul Aug Sept Oct Nov Dec Total # Scans/Ad Location Total # of Scans (All Time) 50005000 Billboard Tradeshow Product Packaging In Store Display Magazine Ad Newspaper Ad 4500 # of Scans (Actual) # of Scans (Goal) 40004000 3500 30003000 25002000 2000 15001000 1000 500 0 0 Jan Feb Mar Apr May Jun Jul Aug Sept Oct Nov Dec Jan Feb Mar Apr May Jun Jul Aug Sept Oct Nov Dec Conversions from QR Landing Pages Total # of QR Code Impressions2000 1775 160,000 1531 1600 1459 1509 14981600 1400 1401 120,000 1200 1210 12501200 1000 80,000800 40,000400 0 0 Jan Feb Mar Apr May Jun Jul Aug Sep Oct Nov Dec Jan Feb Mar Apr May Jun Jul Aug Sept Oct Nov Dec Scan Through Rate(%) Conversions by Landing Page (A/B) 7% 2000 Actual Goal Landing Page #1 Landing Page #2 Landing Page #3 6% 5% 1500 4.1% 4.2% 3.7% 3.9% 3.6% 3.7% 3.9% 4% 3.2% 3.3% 3.1% 3.1% 1000 2.8% 3% 2% 500 1% 0% 0 Jan Feb Mar Apr May Jun Jul Aug Sept Oct Nov Dec Jan Feb Mar Apr May Jun Jul Aug Sept Oct Nov Dec
Digital Traffic By Device Top Pages & Total Page Views 80006000 Mobile Phones Tablets Music Players e-Readers Gaming Devices Other Devices Home Products Catalogue Company Landing Page5000 60004000 400030002000 20001000 0 0 Jan Feb Mar Apr May Jun Jul Aug Sept Oct Nov Dec Jan Feb Mar Apr May Jun Jul Aug Sept Oct Nov Dec Unique Visitors Pages/Visit 525000 3.9 3.8 Actual Goal 3.6 3.6 4 3.4 3.5 3.4 3.5 3.3 3.3 3.2 3.320000 315000 2100005000 1 0 0 Jan Feb Mar Apr May Jun Jul Aug Sep Oct Nov Dec Jan Feb Mar Apr May Jun Jul Aug Sep Oct Nov Dec Bounce Rate Time on Site (Minutes) 2.560% Actual Goal 2.0 Actual Goal50% 2.1 1.9 2.0 2.040% 1.5 1.7 1.7 1.8 1.8 1.930% 1.5 1.6 1.6 1.020% 0.510% 0% 0.0 Jan Feb Mar Apr May Jun Jul Aug Sep Oct Nov Dec Jan Feb Mar Apr May Jun Jul Aug Sep Oct Nov Dec Digital Traffic By Device Top Pages & Total Page Views 80006000 Mobile Phones Tablets Music Players e-Readers Gaming Devices Other Devices Home Products Catalogue Company Landing Page5000 60004000 400030002000 20001000 0 0 Jan Feb Mar Apr May Jun Jul Aug Sept Oct Nov Dec Jan Feb Mar Apr May Jun Jul Aug Sept Oct Nov Dec Unique Visitors Pages/Visit 525000 3.9 3.8 Actual Goal 3.6 3.6 4 3.4 3.5 3.4 3.5 3.3 3.3 3.2 3.320000 315000 2100005000 1 0 0 Jan Feb Mar Apr May Jun Jul Aug Sep Oct Nov Dec Jan Feb Mar Apr May Jun Jul Aug Sep Oct Nov Dec Bounce Rate Time on Site (Minutes) 2.560% Actual Goal 2.0 Actual Goal50% 2.1 1.9 2.0 2.040% 1.5 1.7 1.7 1.8 1.8 1.930% 1.5 1.6 1.6 1.020% 0.510% 0% 0.0 Jan Feb Mar Apr May Jun Jul Aug Sep Oct Nov Dec Jan Feb Mar Apr May Jun Jul Aug Sep Oct Nov Dec
QR Codes Q1 Q2 Q3 Q4Total # of Scans by Ad Location Jan Feb Mar Apr May Jun Jul Aug Sept Oct Nov Dec Billboard 103 106 109 112 115 118 121 124 127 130 133 136 Tradeshow 783 789 795 801 807 813 819 825 831 837 843 849 Product Packaging 513 516 569 580 609 610 610 625 635 640 650 655 In Store Display 200 240 240 280 285 290 295 300 310 310 315 320 Magazine Ad 1000 1100 1100 1250 1250 1275 1275 1400 1410 1411 1425 1520 Newspaper Ad 620 630 640 700 725 756 756 756 764 787 801 802Total # of Scans (All Time) Jan Feb Mar Apr May Jun Jul Aug Sept Oct Nov Dec # of Scans (Actual) 3219 3381 3453 3723 3791 3862 3876 4030 4077 4115 4167 4282 # of Scans (Goal) 3000 3500 3500 3500 4000 4000 4000 4500 4500 4500 4500 4500Conversions from QR Landing Pages Jan Feb Mar Apr May Jun Jul Aug Sept Oct Nov Dec # of Purchases from QR Landing Pages 1000 1200 1210 1250 1400 1459 1401 1509 1498 1531 1600 1775Total # of Impressions Jan Feb Mar Apr May Jun Jul Aug Sep Oct Nov Dec Actual 78495 80394 93040 96049 104950 123144 103940 104059 130455 129405 149856 129450Scan Through Rate (STR) Jan Feb Mar Apr May Jun Jul Aug Sept Oct Nov Dec Actual 4.1% 4.2% 3.7% 3.9% 3.6% 3.1% 3.7% 3.9% 3.1% 3.2% 2.8% 3.3% Goal 6.0% 6.0% 6.0% 6.0% 6.0% 6.0% 6.0% 6.0% 6.0% 6.0% 6.0% 6.0%Conversions by Landing Page (A/B) Jan Feb Mar Apr May Jun Jul Aug Sept Oct Nov Dec Landing Page #1 400 459 500 520 600 524 527 601 588 512 545 599 Landing Page #2 300 320 315 321 319 327 322 329 335 333 341 329 Landing Page #3 300 421 395 410 481 608 552 579 575 686 714 847SMS Q1 Q2 Q3 Q4# of New Opt-Ins per Month Jan Feb Mar Apr May Jun Jul Aug Sept Oct Nov Dec Actual 15000 15500 16000 15575 15999 16123 16001 15185 17100 15250 18050 17456Opt-In List Retention Rate Jan Feb Mar Apr May Jun Jul Aug Sep Oct Nov Dec Actual 90% 89% 87% 75% 76% 74% 75% 74% 73% 73% 72% 73% Goal 85% 85% 85% 85% 85% 85% 85% 85% 85% 85% 85% 85%Opt-In List Size Jan Feb Mar Apr May Jun Jul Aug Sep Oct Nov Dec Total Records 50394 55304 60214 54590 57607 60624 89504 92044 94584 97124 99664 102204Ave. Click Through Rate per Send Jan Feb Mar Apr May Jun Jul Aug Sep Oct Nov Dec As a Percentage 46% 49% 57% 65% 68% 68% 68% 72% 75% 85% 95% 97%Total # of Contest Entries Jan Feb Mar Apr May Jun Jul Aug Sept Oct Nov Dec Actual 7659 7729 7799 7869 7939 8009 8079 8149 8219 8289 8359 8429 Goal 7750 7850 7950 8050 8150 8250 8350 8450 8550 8650 8750 8850Revenue Generated Via SMS Jan Feb Mar Apr May Jun Jul Aug Sept Oct Nov Dec Actual $51,034 $51,034 $51,034 $51,034 $51,034 $56,839 $56,839 $56,839 $56,839 $56,839 $56,839 $56,839 Goal $56,000 $56,000 $56,000 $56,000 $56,000 $56,000 $57,000 $57,000 $57,000 $57,000 $57,000 $57,000Display Q1 Q2 Q3 Q4Clicks by Mobile App Ad Location Jan Feb Mar Apr May Jun Jul Aug Sept Oct Nov Dec Industry App 500 525 550 575 600 625 650 675 700 725 750 775 Game App 200 215 230 245 260 275 290 305 320 335 350 365 News App 300 310 320 330 340 350 360 370 380 390 400 410 Association App 600 630 660 690 720 750 780 810 840 870 900 930 QR Codes Q1 Q2 Q3 Q4Total # of Scans by Ad Location Jan Feb Mar Apr May Jun Jul Aug Sept Oct Nov Dec Billboard 103 106 109 112 115 118 121 124 127 130 133 136 Tradeshow 783 789 795 801 807 813 819 825 831 837 843 849 Product Packaging 513 516 569 580 609 610 610 625 635 640 650 655 In Store Display 200 240 240 280 285 290 295 300 310 310 315 320 Magazine Ad 1000 1100 1100 1250 1250 1275 1275 1400 1410 1411 1425 1520 Newspaper Ad 620 630 640 700 725 756 756 756 764 787 801 802Total # of Scans (All Time) Jan Feb Mar Apr May Jun Jul Aug Sept Oct Nov Dec # of Scans (Actual) 3219 3381 3453 3723 3791 3862 3876 4030 4077 4115 4167 4282 # of Scans (Goal) 3000 3500 3500 3500 4000 4000 4000 4500 4500 4500 4500 4500Conversions from QR Landing Pages Jan Feb Mar Apr May Jun Jul Aug Sept Oct Nov Dec # of Purchases from QR Landing Pages 1000 1200 1210 1250 1400 1459 1401 1509 1498 1531 1600 1775Total # of Impressions Jan Feb Mar Apr May Jun Jul Aug Sep Oct Nov Dec Actual 78495 80394 93040 96049 104950 123144 103940 104059 130455 129405 149856 129450Scan Through Rate (STR) Jan Feb Mar Apr May Jun Jul Aug Sept Oct Nov Dec Actual 4.1% 4.2% 3.7% 3.9% 3.6% 3.1% 3.7% 3.9% 3.1% 3.2% 2.8% 3.3% Goal 6.0% 6.0% 6.0% 6.0% 6.0% 6.0% 6.0% 6.0% 6.0% 6.0% 6.0% 6.0%Conversions by Landing Page (A/B) Jan Feb Mar Apr May Jun Jul Aug Sept Oct Nov Dec Landing Page #1 400 459 500 520 600 524 527 601 588 512 545 599 Landing Page #2 300 320 315 321 319 327 322 329 335 333 341 329 Landing Page #3 300 421 395 410 481 608 552 579 575 686 714 847SMS Q1 Q2 Q3 Q4# of New Opt-Ins per Month Jan Feb Mar Apr May Jun Jul Aug Sept Oct Nov Dec Actual 15000 15500 16000 15575 15999 16123 16001 15185 17100 15250 18050 17456Opt-In List Retention Rate Jan Feb Mar Apr May Jun Jul Aug Sep Oct Nov Dec Actual 90% 89% 87% 75% 76% 74% 75% 74% 73% 73% 72% 73% Goal 85% 85% 85% 85% 85% 85% 85% 85% 85% 85% 85% 85%Opt-In List Size Jan Feb Mar Apr May Jun Jul Aug Sep Oct Nov Dec Total Records 50394 55304 60214 54590 57607 60624 89504 92044 94584 97124 99664 102204Ave. Click Through Rate per Send Jan Feb Mar Apr May Jun Jul Aug Sep Oct Nov Dec As a Percentage 46% 49% 57% 65% 68% 68% 68% 72% 75% 85% 95% 97%Total # of Contest Entries Jan Feb Mar Apr May Jun Jul Aug Sept Oct Nov Dec Actual 7659 7729 7799 7869 7939 8009 8079 8149 8219 8289 8359 8429 Goal 7750 7850 7950 8050 8150 8250 8350 8450 8550 8650 8750 8850Revenue Generated Via SMS Jan Feb Mar Apr May Jun Jul Aug Sept Oct Nov Dec Actual $51,034 $51,034 $51,034 $51,034 $51,034 $56,839 $56,839 $56,839 $56,839 $56,839 $56,839 $56,839 Goal $56,000 $56,000 $56,000 $56,000 $56,000 $56,000 $57,000 $57,000 $57,000 $57,000 $57,000 $57,000Display Q1 Q2 Q3 Q4Clicks by Mobile App Ad Location Jan Feb Mar Apr May Jun Jul Aug Sept Oct Nov Dec Industry App 500 525 550 575 600 625 650 675 700 725 750 775 Game App 200 215 230 245 260 275 290 305 320 335 350 365 News App 300 310 320 330 340 350 360 370 380 390 400 410 Association App 600 630 660 690 720 750 780 810 840 870 900 930
Industry App 2 700 743 786 829 872 915 958 1001 1044 1087 1130 1173 News App 2 350 375 400 425 450 475 500 525 550 575 600 625Revenue by Rich Media Display Ad Jan Feb Mar Apr May Jun Jul Aug Sep Oct Nov Dec Actual $410,000 $419,000 $428,000 $437,000 $399,000 $455,000 $464,000 $430,000 $482,000 $491,000 $750,000 $509,000# of Display Ad Impressions Jan Feb Mar Apr May Jun Jul Aug Sep Oct Nov Dec Actual 12995 13203 13411 13619 13827 16043 16940 17837 18734 19631 20528 21425 Goal 13000 13500 14000 14500 15000 15500 16000 16500 17000 17500 18000 17500% of Click to Call Jan Feb Mar Apr May Jun Jul Aug Sep Oct Nov Dec Actual 0.2% 0.4% 0.6% 0.8% 1.0% 1.2% 1.4% 1.6% 1.8% 2.0% 2.2% 2.4%% of Click to Web Jan Feb Mar Apr May Jun Jul Aug Sep Oct Nov Dec Actual 1.7% 1.9% 2.1% 2.3% 2.5% 2.7% 2.4% 2.4% 3.2% 3.6% 3.4% 3.3%Click Though Rate by App Display Ad (A/B Testing) Display Ad #1 A 3.1% Display Ad #1 B 3.6% Display Ad #2 A 2.5% Display Ad #2 B 2.0% Display Ad #3 A 5.3% Display Ad #3 B 7.3%Mobile Website Metrics Q1 Q2 Q3 Q4Digital Traffic By Device Jan Feb Mar Apr May Jun Jul Aug Sept Oct Nov Dec Mobile Phones 3404 3483 3562 3641 3720 3799 3878 3957 4036 4115 4194 4273 Tablets 294 302 310 318 326 334 342 350 358 366 374 382 Music Players 234 245 256 267 278 289 300 311 322 333 344 355 e-Readers 139 145 151 157 163 169 175 181 187 193 199 205 Gaming Devices 31 34 37 40 43 46 49 52 55 58 61 64 Other Devices 24 29 34 39 44 49 54 59 64 69 74 79Top Pages Jan Feb Mar Apr May Jun Jul Aug Sept Oct Nov Dec Home 2030 2100 2170 2240 2310 2380 2450 2520 2590 2660 2730 2800 Products 1195 1239 1283 1327 1371 1415 1459 1503 1547 1591 1635 1679 Catalogue 693 724 755 786 817 848 879 910 941 972 1003 1034 Company 280 340 400 460 520 580 640 700 760 820 880 940 Landing Page 181 193 205 217 229 241 253 265 277 289 301 313Unique Visitors Jan Feb Mar Apr May Jun Jul Aug Sep Oct Nov Dec Actual 12995 13203 13411 13619 13827 17856 18496 19400 18734 19631 20528 21425 Goal 15000 15000 15000 15000 15000 15000 15000 17500 17500 17500 17500 17500Pages/Visit Jan Feb Mar Apr May Jun Jul Aug Sep Oct Nov Dec Actual 3.3 3.4 3.3 3.6 3.2 3.6 3.3 3.5 3.4 3.9 3.8 3.5Bounce Rate Jan Feb Mar Apr May Jun Jul Aug Sep Oct Nov Dec Actual 41% 39% 40% 46% 47% 39% 51% 48% 39% 51% 49% 48% Goal 40% 40% 40% 40% 40% 40% 40% 40% 40% 40% 40% 40%Time on Site (Minutes) Jan Feb Mar Apr May Jun Jul Aug Sep Oct Nov Dec Actual 1.5 1.6 1.6 1.7 1.7 1.8 1.8 1.9 1.9 2.0 2.0 2.1 Goal 2.0 2.0 2.0 2.0 2.0 2.0 2.0 2.0 2.0 2.0 2.0 2.0 Industry App 2 700 743 786 829 872 915 958 1001 1044 1087 1130 1173 News App 2 350 375 400 425 450 475 500 525 550 575 600 625Revenue by Rich Media Display Ad Jan Feb Mar Apr May Jun Jul Aug Sep Oct Nov Dec Actual $410,000 $419,000 $428,000 $437,000 $399,000 $455,000 $464,000 $430,000 $482,000 $491,000 $750,000 $509,000# of Display Ad Impressions Jan Feb Mar Apr May Jun Jul Aug Sep Oct Nov Dec Actual 12995 13203 13411 13619 13827 16043 16940 17837 18734 19631 20528 21425 Goal 13000 13500 14000 14500 15000 15500 16000 16500 17000 17500 18000 17500% of Click to Call Jan Feb Mar Apr May Jun Jul Aug Sep Oct Nov Dec Actual 0.2% 0.4% 0.6% 0.8% 1.0% 1.2% 1.4% 1.6% 1.8% 2.0% 2.2% 2.4%% of Click to Web Jan Feb Mar Apr May Jun Jul Aug Sep Oct Nov Dec Actual 1.7% 1.9% 2.1% 2.3% 2.5% 2.7% 2.4% 2.4% 3.2% 3.6% 3.4% 3.3%Click Though Rate by App Display Ad (A/B Testing) Display Ad #1 A 3.1% Display Ad #1 B 3.6% Display Ad #2 A 2.5% Display Ad #2 B 2.0% Display Ad #3 A 5.3% Display Ad #3 B 7.3%Mobile Website Metrics Q1 Q2 Q3 Q4Digital Traffic By Device Jan Feb Mar Apr May Jun Jul Aug Sept Oct Nov Dec Mobile Phones 3404 3483 3562 3641 3720 3799 3878 3957 4036 4115 4194 4273 Tablets 294 302 310 318 326 334 342 350 358 366 374 382 Music Players 234 245 256 267 278 289 300 311 322 333 344 355 e-Readers 139 145 151 157 163 169 175 181 187 193 199 205 Gaming Devices 31 34 37 40 43 46 49 52 55 58 61 64 Other Devices 24 29 34 39 44 49 54 59 64 69 74 79Top Pages Jan Feb Mar Apr May Jun Jul Aug Sept Oct Nov Dec Home 2030 2100 2170 2240 2310 2380 2450 2520 2590 2660 2730 2800 Products 1195 1239 1283 1327 1371 1415 1459 1503 1547 1591 1635 1679 Catalogue 693 724 755 786 817 848 879 910 941 972 1003 1034 Company 280 340 400 460 520 580 640 700 760 820 880 940 Landing Page 181 193 205 217 229 241 253 265 277 289 301 313Unique Visitors Jan Feb Mar Apr May Jun Jul Aug Sep Oct Nov Dec Actual 12995 13203 13411 13619 13827 17856 18496 19400 18734 19631 20528 21425 Goal 15000 15000 15000 15000 15000 15000 15000 17500 17500 17500 17500 17500Pages/Visit Jan Feb Mar Apr May Jun Jul Aug Sep Oct Nov Dec Actual 3.3 3.4 3.3 3.6 3.2 3.6 3.3 3.5 3.4 3.9 3.8 3.5Bounce Rate Jan Feb Mar Apr May Jun Jul Aug Sep Oct Nov Dec Actual 41% 39% 40% 46% 47% 39% 51% 48% 39% 51% 49% 48% Goal 40% 40% 40% 40% 40% 40% 40% 40% 40% 40% 40% 40%Time on Site (Minutes) Jan Feb Mar Apr May Jun Jul Aug Sep Oct Nov Dec Actual 1.5 1.6 1.6 1.7 1.7 1.8 1.8 1.9 1.9 2.0 2.0 2.1 Goal 2.0 2.0 2.0 2.0 2.0 2.0 2.0 2.0 2.0 2.0 2.0 2.0