1 / 5
50 likes | 70 Views
Get this template plus 350 other premium business tools & templates at www.demandmetric.com

E N D
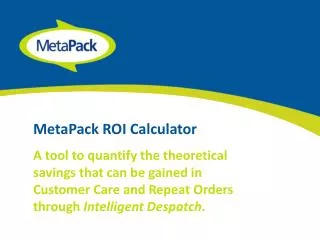
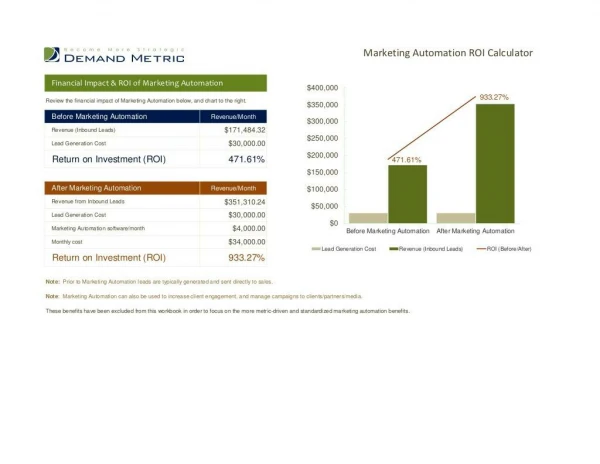
Marketing Automation ROI Calculator Marketing Automation ROI Calculator Financial Impact & ROI of Marketing Automation $400,000 1000.00%Review the financial impact of Marketing Automation below, and chart to the right. 933.27% 900.00% $350,000 800.00% Before Marketing Automation Revenue/Month $300,000 700.00% Revenue (Inbound Leads) $171,484.32 $250,000 600.00% Lead Generation Cost $30,000.00 $200,000 500.00% Return on Investment (ROI) 471.61% 471.61% 400.00% $150,000 300.00% After Marketing Automation Revenue/Month $100,000 200.00% Revenue from Inbound Leads $351,310.24 $50,000 100.00% Lead Generation Cost $30,000.00 $0 0.00% Marketing Automation software/month $4,000.00 Before Marketing Automation After Marketing Automation Monthly cost $34,000.00 Lead Generation Cost Revenue (Inbound Leads) ROI (Before/After) Return on Investment (ROI) 933.27%Note: Prior to Marketing Automation leads are typically generated and sent directly to sales.Note: Marketing Automation can also be used to increase client engagement, and manage campaigns to clients/partners/media.These benefits have been excluded from this workbook in order to focus on the more metric-driven and standardized marketing automation benefits.
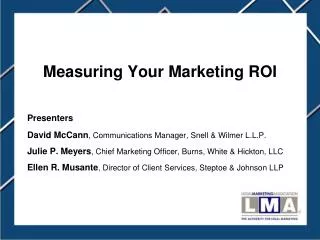
Marketing Automation ROI CalculatorFill in the following worksheet. Use the instructions in the right hand column if you need assistance.Input data in the beige cells provided. White cells will automatically populate/calculate. Scroll to the bottom for ROI calculations. Financial Impact of Lead Generation, Scoring & Nurturing Changes with Marketing Automation Software Change Due Forecast Marketing Function Key Metrics & Cost Current To Marketing Notes What to Enter (6 months) Automation Lead Generation Enter how many clicks Marketing Automation will not per month go to your Search Engine Marketing Clicks/month 300,000 300,000 0.00% directly affect your click volume in paid and un-paid lead SEM campaigns. generation landing pages. A/B testing of landing pages will increase conversion rate Your current conversion NOTE: This form calculates a rate of form Key Change Landing Page Conversion Rate 6.34% 7.61% 20.00% 20% increase in landing page completion/clicks AND conversion rates. Adjust to your projected increase your organizations forecast as in conversion rate. necessary. Your current monthly No change in overall SEM budget, direct lead gen. costs. Search Engine Marketing Costs $30,000 $30,000 0.00% just getting more for your dollar. E.g., Google AdWords, Events, Paid Lists. With pay-per-click, more paid Cost-per-lead $1.58 $1.31 -16.67% traffic converting to a lead results in decreased cost-per-lead. Marketing Automation ROI CalculatorFill in the following worksheet. Use the instructions in the right hand column if you need assistance.Input data in the beige cells provided. White cells will automatically populate/calculate. Scroll to the bottom for ROI calculations. Financial Impact of Lead Generation, Scoring & Nurturing Changes with Marketing Automation Software Change Due Forecast Marketing Function Key Metrics & Cost Current To Marketing Notes What to Enter (6 months) Automation Lead Generation Enter how many clicks Marketing Automation will not per month go to your Search Engine Marketing Clicks/month 300,000 300,000 0.00% directly affect your click volume in paid and un-paid lead SEM campaigns. generation landing pages. A/B testing of landing pages will increase conversion rate Your current conversion NOTE: This form calculates a rate of form Key Change Landing Page Conversion Rate 6.34% 7.61% 20.00% 20% increase in landing page completion/clicks AND conversion rates. Adjust to your projected increase your organizations forecast as in conversion rate. necessary. Your current monthly No change in overall SEM budget, direct lead gen. costs. Search Engine Marketing Costs $30,000 $30,000 0.00% just getting more for your dollar. E.g., Google AdWords, Events, Paid Lists. With pay-per-click, more paid Cost-per-lead $1.58 $1.31 -16.67% traffic converting to a lead results in decreased cost-per-lead.
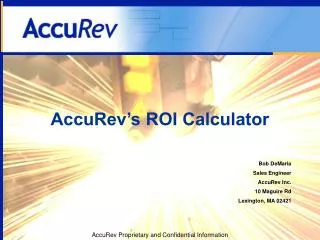
Inbound Marketing Leads/month 19,020 22,824 20.00% Often leads are lost after removal Enter your current scrub % of Leads Lost to Lead Scrubbing 30.00% 30.00% 0.00% of duplicate entries or bad data. rate.Lead Scoring Lead scoring will decrease the monthly volume of sales-ready leads initially, but will dramatically Most organizations increase the quality. without Marketing % of Leads Deemed Sales-Ready 100.00% 25.00% -75.00% Automation forward all NOTE: This form calculates that 25% of inbound leads w ill be scored " sales- Leads to Sales. ready" . The remainder w ill go to lead nurturing data base. Fewer leads are considered sales- Key Change Sales-Ready Leads/month 13,314 3,994 -70.00% ready, but sales-ready leads will be more qualified. NOTE: This form assumes that Enter your current 80% of leads scored as sales- opportunity/leads rate ready will convert to Key Change Opportunities/Lead 20.00% 80.00% 300.00% opportunities. You can adjust AND your forcasted increase in this metric to fit your opportunity/leads. organizations expectations. Overall slight increase in volume Opportunities/month 2,663 3,195 20.00% of opportunities per month despite drop in leads entered into funnel.Lead Nurturing Inbound Marketing Leads/month 19,020 22,824 20.00% Often leads are lost after removal Enter your current scrub % of Leads Lost to Lead Scrubbing 30.00% 30.00% 0.00% of duplicate entries or bad data. rate.Lead Scoring Lead scoring will decrease the monthly volume of sales-ready leads initially, but will dramatically Most organizations increase the quality. without Marketing % of Leads Deemed Sales-Ready 100.00% 25.00% -75.00% Automation forward all NOTE: This form calculates that 25% of inbound leads w ill be scored " sales- Leads to Sales. ready" . The remainder w ill go to lead nurturing data base. Fewer leads are considered sales- Key Change Sales-Ready Leads/month 13,314 3,994 -70.00% ready, but sales-ready leads will be more qualified. NOTE: This form assumes that Enter your current 80% of leads scored as sales- opportunity/leads rate ready will convert to Key Change Opportunities/Lead 20.00% 80.00% 300.00% opportunities. You can adjust AND your forcasted increase in this metric to fit your opportunity/leads. organizations expectations. Overall slight increase in volume Opportunities/month 2,663 3,195 20.00% of opportunities per month despite drop in leads entered into funnel.Lead Nurturing
Nurturing can/will increase your data base if you purchase lists and work towards warming them to a Enter the number of Lead data base 100,000 100,000 0.00% sales-ready state. For the leads in your data base. purpose of this calculator this was excluded. Enter the current % of NOTE: This form adds 2% as the leads being warmed from expected volume of warm leads your data base (enter 0 if % of Sales-ready leads coming from Key Change 0.00% 2.00% N/A coming from your lead data you are not doing lead the lead data base base. Adjust for your warming) AND your organization if necessary. projected rate of increase in volume warm leads. Opportunities from Lead data Opportunities from nurturing the base/month 0 2,000 N/A data base.Sales Opportunities from lead scoring inbound marketing leads AND Key Change Total Opportunities/month 2,663 5,195 95.11% opportunities from nurturing the data base. With lead scoring and Lead Enter your current nurturing, leads are sent to sales sales/opportunity at the right phase in the buying conversion rate AND Key Change Sales/Opportunities 6.44% 6.76% 5.00% cycle. This will increase the sales your projected increase conversion rate. in rate of NOTE: This form calculates a sales/opportunities. 5% increase. Adjust to fit your Sales/month 171 351 104.86% Average sale may increase but is Enter your average sale Average Sale $1,000 1,000 0.00% not used in this ROI calculation. value. Nurturing can/will increase your data base if you purchase lists and work towards warming them to a Enter the number of Lead data base 100,000 100,000 0.00% sales-ready state. For the leads in your data base. purpose of this calculator this was excluded. Enter the current % of NOTE: This form adds 2% as the leads being warmed from expected volume of warm leads your data base (enter 0 if % of Sales-ready leads coming from Key Change 0.00% 2.00% N/A coming from your lead data you are not doing lead the lead data base base. Adjust for your warming) AND your organization if necessary. projected rate of increase in volume warm leads. Opportunities from Lead data Opportunities from nurturing the base/month 0 2,000 N/A data base.Sales Opportunities from lead scoring inbound marketing leads AND Key Change Total Opportunities/month 2,663 5,195 95.11% opportunities from nurturing the data base. With lead scoring and Lead Enter your current nurturing, leads are sent to sales sales/opportunity at the right phase in the buying conversion rate AND Key Change Sales/Opportunities 6.44% 6.76% 5.00% cycle. This will increase the sales your projected increase conversion rate. in rate of NOTE: This form calculates a sales/opportunities. 5% increase. Adjust to fit your Sales/month 171 351 104.86% Average sale may increase but is Enter your average sale Average Sale $1,000 1,000 0.00% not used in this ROI calculation. value.
Enter your marketing Marketing Automation Software cost/month $4,000 automation cost/quote per monthROI of Marketing Automation - Cumulative Impact of Lead Generation, Scoring & Nurturing Before Marketing Automation After Marketing AutomationRevenue from Inbound Leads $171,484.32 Revenue from Inbound Leads $351,310.24Lead Generation Cost $30,000.00 Lead Generation Cost $30,000.00ROI 471.61% LMA software/month $4,000.00 Monthly cost $34,000.00 ROI 933.27% Enter your marketing Marketing Automation Software cost/month $4,000 automation cost/quote per monthROI of Marketing Automation - Cumulative Impact of Lead Generation, Scoring & Nurturing Before Marketing Automation After Marketing AutomationRevenue from Inbound Leads $171,484.32 Revenue from Inbound Leads $351,310.24Lead Generation Cost $30,000.00 Lead Generation Cost $30,000.00ROI 471.61% LMA software/month $4,000.00 Monthly cost $34,000.00 ROI 933.27%