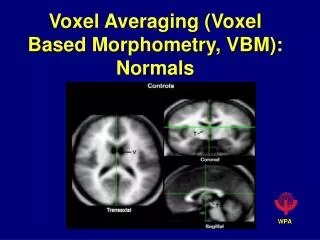
VBM Voxel-based morphometry
VBM Voxel-based morphometry. Floris de Lange Most slides taken/adapted from: Nicola Hobbs & Marianne Novak http://www.fil.ion.ucl.ac.uk/mfd/. Overview. Background (What is VBM?) Pre-processing steps Analysis Multiple comparisons Pros and cons of VBM Optional extras. What is VBM?.


VBM Voxel-based morphometry
E N D
Presentation Transcript
VBMVoxel-based morphometry Floris de Lange Most slides taken/adapted from: Nicola Hobbs & Marianne Novak http://www.fil.ion.ucl.ac.uk/mfd/
Overview • Background (What is VBM?) • Pre-processing steps • Analysis • Multiple comparisons • Pros and cons of VBM • Optional extras
What is VBM? • VBM is a voxel-wise comparison of local tissue volumes within a group or across groups • Whole-brain analysis, does not require a priori assumptions about ROIs; unbiased way of localising structural changes • Can be automated, requires little user intervention compare to manual ROI tracing
Basic Steps • Spatial normalisation (alignment) into standard space • Segmentation of tissue classes • Modulation - adjust for volume changes during normalisation • Smoothing - each voxel is a weighted average of surrounding voxels • Statistics - localise & make inferences about differences
Step 1: normalisation • Aligns images by warping to standard stereotactic space • Affine step – translation, rotation, scaling, shearing • Non-linear step • Adjust for differences in • head position/orientation in scanner • global brain shape • Any remaining differences (detectable by VBM) are due to smaller-scale differences in volume
ORIGINAL IMAGE SPATIAL NORMALISATION SPATIALLY NORMALISED IMAGE TEMPLATE IMAGE
Normalization – linear transformations • parameter affine transform • 3 translations • 3 rotations • 3 zooms • 3 shears • Fits overall shape and size
Normalization – nonlinear transformations Deformations consist of a linear combination of smooth basis functions These are the lowest frequencies of a 3D discrete cosine transform (DCT)
SPATIALLY NORMALISED IMAGE WHITE MATTER CSF GREY MATTER 2. Tissue segmentation • Aims to classify image as GM, WM or CSF • Two sources of information a) Spatial prior probability maps b) Intensity information in the image itself
a) Spatial prior probability maps • Smoothed average of GM from MNI • Intensity at each voxel represents probability of being GM • SPM compares the original image to this to help work out the probability of each voxel in the image being GM (or WM, CSF)
b) Image intensities • Intensities in the image fall into roughly 3 classes • SPM can also assign a voxel to a tissue class by seeing what its intensity is relative to the others in the image • Each voxel has a value between 0 and 1, representing the probability of it being in that particular tissue class • Includes correction for image intensity non-uniformity
Corrected image Image with bias artefact • The contrast of a scan may not be the same everywhere • This makes it more difficult to partition the scan in different tissue types • Bias correction estimates and removes this bias Bias correction
Generative model • Segmentation into tissue types • Bias Correction • Normalisation • These steps cycled through until normalisation and segmentation criteria are met
Step 3: modulation • Corrects for changes in volume induced by normalisation • Voxel intensities are multiplied by the local value in the deformation field from normalisation, so that total GM/WM signal remains the same • Allows us to make inferences about volume, instead of concentration
i i i / δV X δV normalisation modulation Modulation • E.g. During normalisation TL in AD subject expands to double the size • Modulation multiplies voxel intensities by Jacobian from normalisation process (halve intensities in this case). • Intensity now represents relative volume at that point
Is modulation optional? • Unmodulated data: compares “the proportion of grey or white matter to all tissue types within a region” • Hard to interpret • Not useful for looking at e.g. the effects of degenerative disease • Modulated data: compares volumes • Unmodulated data may be useful for highlighting areas of poor registration (perfectly registered unmodulated data should show no differences between groups)
Step 4: Smoothing • Convolve with an isotropic Gaussian kernel • Each voxel becomes weighted average of surrounding voxels • Smoothing renders the data more normally distributed (Central Limit theorem) • Required if using parametric statistics • Smoothing compensates for inaccuracies in normalisation • Makes mass univariate analysis more like multivariate analysis • Filter size should match the expected effect size • Usually between 8 – 14mm
8 mm Smoothing SMOOTH WITH 8MM KERNEL
VBM: Analysis • What does the SPM show in VBM? • Cross-sectional VBM • Multiple comparison corrections • Pros and cons of VBM • Optional extras
VBM: Cross-sectional analysis overview • T1-weighted MRI from one or more groups at a single time point • Analysis compares (whole or part of) brain volume between groups, or correlates volume with another measurement at that time point • Generates map of voxel intensities: represent volume of, or probability of being in, a particular tissue class
What is the question in VBM analysis? • Take a single voxel, and ask: “are the intensities in the AD images significantly different to those in the control images for this particular voxel?” • eg is the GM intensity (volume) lower in the AD group cf controls? • ie do a simple t-test on the voxel intensities Control AD
Statistical Parametric Maps (SPM) • Repeat this for all voxels • Highlights all voxels where intensities (volume) are significantly different between groups: the SPM • SPM showing regions where Huntington’s patients have lower GM intensity than controls • Colour bar shows the t-value
VBM: correlation • Correlate images and test scores (eg Alzheimer’s patients with memory score) • SPM shows regions of GM or WM where there are significant associations between intensity (volume) and test score • V = β1(test score) + β2(age) + β3(gender) + β4(global volume) + μ + ε • Contrast of interest is whether β1 (slope of association between intensity & test score) is significantly different to zero
Correcting for Multiple Comparisons • 200,000 voxels per scan ie 200,000 t-tests • If you do 200,000 t-tests at p<0.05, by chance 10,000 will be false positives • Bad practice… • A strict Bonferroni correction would reduce the p value for each test to 0.00000025 • However, voxel intensities are not independent, but correlated with their neighbours • Bonferroni is therefore too harsh a correction and will lose true results
Familywise Error • SPM uses Gaussian Random Field theory (GRF)1 • Using FWE, p<0.05: 5% of ALL our SPMs will contain a false positive voxel • This effectively controls the number of false positive regions rather than voxels • Can be thought of as a Bonferroni-type correction, allowing for multiple non-independent tests • Good: a “safe” way to correct • Bad: but we are probably missing a lot of true positives 1 http://www.mrc-cbu.cam.ac.uk/Imaging/Common/randomfields.shtml
q value FDR q<0.05 False Discovery Rate • FDR more recent • It controls the expected proportion of false positives among suprathreshold voxels only • Using FDR, q<0.05: we expect 5% of the voxels for each SPM to be false positives (1,000 voxels) • Bad: less stringent than FWE so more false positives • Good: fewer false negatives (ie more true positives) • But: assumes independence of voxels: avoid….? Voxel
VBM Pros 1. SPM normalization procedure is rather crude • Not ideal for subcortical (well-delineated) structures • More difficult to pick up differences in areas with high inter-subject variance: low signal to noise ratio 1. Objective analysis 2. Do not need priors – more exploratory 3. Automated VBM Cons
Standard preprocessing: areas of decreased volume in depressed subjects DARTEL preprocessing: areas of decreased volume in depressed subjects
Resources and references • http://www.fil.ion.ucl.ac.uk/spm (the SPM homepage) • http://imaging.mrc-cbu.cam.ac.uk/imaging/CbuImaging (neurimaging wiki homepage) • http://www.mrc-cbu.cam.ac.uk/Imaging/Common/randomfields.shtml (for multiple comparisons info) • Ashburner J, Friston KJ. Voxel-based morphometry--the methods. Neuroimage 2000; 11: 805-821 (the original VBM paper) • Good CD, Johnsrude IS, Ashburner J, Henson RN, Friston KJ, Frackowiak RS. A voxel-based morphometric study of ageing in 465 normal adult human brains. Neuroimage 2001; 14: 21-36 (the optimised VBM paper) • Ridgway GR, Henley SM, Rohrer JD, Scahill RI, Warren JD, Fox NC. Ten simple rules for reporting voxel-based morphometry studies. Neuroimage 2008.