Download
1 / 12
120 likes | 190 Views
Research on interpreting weather forecasts with uncertainties, preferences for deterministic vs. explicit forecasts, user feedback on forecast formats, and the impact of forecast clarity on user behavior.

E N D
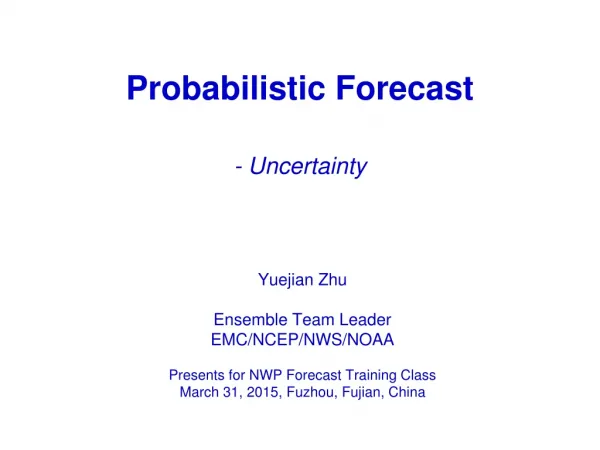
Providing Weather Forecast Uncertainty Information to the Public Julie Demuth, Rebecca E. Morss, Jeffrey K. Lazo NCAR Societal Impacts Program Boulder, CO 2008 WAS*IS Workshop August 12, 2008 USWRP
Suppose the forecast says, “There is a 60% chance of rain tomorrow.” What do you think best describes what the forecast means? Response option Percent of respondents It will rain tomorrow in 60% of the region. It will rain tomorrow for 60% of the time. It will rain on 60% of the days like tomorrow. 60% of weather forecasters believe that it will rain tomorrow. I don’t know. Other (please explain)
Uncertainty research questions • How much confidence do people have in different types of weather forecasts? • Do people infer uncertainty into deterministic forecasts and, if so, how much? • How do people interpret a type of uncertainty forecast that is already commonly available and familiar: probability of precipitation forecasts? • To what extent do people prefer to receive deterministic vs. uncertainty-explicit forecasts? • In what formats do people prefer to receive forecast uncertainty information?
How do people interpret a type of uncertainty forecast that is already commonly available and familiar -- probability of precipitation (PoP) forecasts? • ~ 90% of respondents received close-ended version of the question • ~10% of respondents received open-ended version
Suppose the forecast says, “There is a 60% chance of rain tomorrow.” 16% 10% 19% 23% 9% 24% What do you think best describes what the forecast means? Response option (N=1330) Percent of respondents It will rain tomorrow in 60% of the region. It will rain tomorrow for 60% of the time. It will rain on 60% of the days like tomorrow.* 60% of weather forecasters believe that it will rain tomorrow. I don’t know. Other (please explain) * Technically correct interpretation, according to how PoP forecasts are verified (Gigerenzer et al. 2005)
Open-ended responses re: PoP • Interesting insight from the responses to open-ended question and “other” write-in responses • Many reiterate PoP without clarification • Many describe the chance they’ll personally experience rain or personal implications for action • Consistent with other studies, majority of people don’t know technically correct definition of PoP… • …but asking people to think about PoP from a meteorological perspective may have limited value … people still have to infer what it means to them!
To what extent do people prefer to receive deterministic vs. uncertainty-explicit forecasts? • In what formats do people prefer to receive forecast uncertainty information?
All the choices below are the same as a probability of precipitation of 20%. Do you like the information given this way? • Chance of precipitation is 20% • There is a 1 in 5 chance of precipitation • The odds are 1 to 4 that it will rain • There is a slight chance of rain tomorrow Percent Frequency Odds Text Asked this question 3 ways -- using PoPs of 20%, 50%, and 80% with corresponding text descriptions from NWS
Percent of respondents who said “yes” 100% PoP of 20% 90% PoP of 50% PoP of 80% 80% 70% 60% 50% 40% 30% 20% 10% 0% Percent Frequency Odds Text N = 489, 489, 487
Suppose the high temperature tomorrow will probably be 85ºF. A cold front may move through, making the high only 70ºF. …will most likely be 85°F, but it may be 70°F (WITHOUT explanation) …will most likely be 85°F, but it may be 70°F, because a cold front may move through (WITH explanation) …will be between 70°F and 85°F …will be between 70°F and 85°F, because a cold front may move through 80% chance it will be 85°F, 20% chance it will be 70°F 80% chance it will be 85°F, 20% chance it will be 70°F, because a cold front may move through Would you like the forecast given this way? The high temperature tomorrow… …will be 85°F
Percent of respondents who said “yes" Will be 85°F 0% 10% 20% 30% 40% 50% 60% Without cold front explanation With cold front explanation Most likely 85°F but may be 70°F Between 70-85°F 80% chance 85°F and 20% chance 70°F 0% 10% 20% 30% 40% 50% 60% Deterministic ~35% Deterministic only ~7% Uncertainty >90% Uncertainty only ~63% N=1465
Discussion Topics • Balance between “educating” the users and understanding users’ needs, wants, uses? • Proliferation of weather information, different sources, different media, etc. • People’s desire for getting consistent info • On-air constraints for broadcasters