Download
1 / 35
350 likes | 470 Views
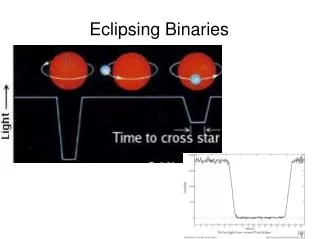
Eclipsing Binaries Converting your observations into a light curve. If you have observed the whole eclipse in one night its easy to create a light curve.

E N D
Eclipsing BinariesConverting your observations into a light curve
If you have observed the whole eclipse in one night its easy to create a light curve However, we often have to combine observations made on different nights, either because the eclipse takes too long, or because the weather interrupts our observations
Beta Lyrae has an orbital period of just under 13 days Here are my observations of beta Lyrae from 2009 …
Date Time(UT) Mag 28/05/2009 23:01 3.56 29/05/2009 22:37 3.81 30/05/2009 00:48 3.89 30/05/2009 22:29 3.99 31/05/2009 22:49 3.81 03/06/2009 22:40 3.66 11/06/2009 22:43 4.19 15/06/2009 22:43 3.71 23/06/2009 23:58 3.66 29/06/2009 23:45 3.56 03/07/2009 22:49 3.71 09/07/2009 23:50 3.71 16/07/2009 00:37 3.71 24/07/2009 23:33 3.51 27/07/2009 22:05 3.99 Date Time(UT) Mag 31/07/2009 00:24 3.79 02/08/2009 00:41 3.71 13/08/2009 22:05 3.81 17/08/2009 21:16 3.76 20/08/2009 21:24 3.66 21/08/2009 20:51 3.81 27/08/2009 23:27 3.66 09/09/2009 20:35 3.43 12/09/2009 19:55 3.56 15/09/2009 19:54 3.53 18/09/2009 19:32 3.61 12/10/2009 18:34 3.89 12/12/2009 18:05 3.53 19/12/2009 06:34 3.66 20/12/2009 06:26 3.61 Beta Lyrae mags
If you simply plot this data as a light curve , the result is disappointing…
What you would prefer is the next light curve showing the primary eclipse near phase 0 and a secondary eclipse near phase 0.5
Phases • The difference between the previous two light curves is that, whereas the first showed the calendar date, the second shows the phase (the fraction of the orbital period completed) • In order to calculate the (predicted) phase at the time of each observation, we need to know the “orbital elements” of the system • The place to look for these is in the General Catalogue of Variable Stars (GCVS)
GCVS elements http://www.sai.msu.su/gcvs/cgi-bin/search.htm For beta Lyrae this gives Epoch = 2408247.950 Period = 12.913834 days (the Epoch is the Julian Date of a previous eclipse)
Why Eclipsing Binaries are interesting • If the orbital periods were fixed, there would be little reason to observe EBs regularly • However, for many eclipsing binaries, the orbital period slowly changes over the years • by comparing the observed times of eclipses with the predicted times, amateurs can help monitor how the orbital period is changing
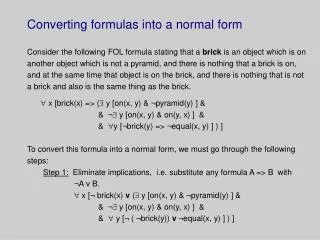
So, how do we use these elements to convert our dates and times into (predicted) phases ?
Back in the 1980s … For each observation you had to …. • Look up the Julian Day number • Look up the Decimal fraction of the day • Use a pocket calculator to calculate the phase … • Plot using graph paper This was very time consuming and prone to errors
The 1990s • The 1990s brought us PCs and spreadsheets and made the process so much easier • First of all, key your observations into a spreadsheet, with the dates, times and magnitudes in separate columns …
Excel stores the date as a day number.To convert it to the Julian Day Number :type =B2+15019 in cell E2(you will also need to use the Format drop down menu to set the Cell to General) Then highlight cell E2, click on the bottom right hand corner of the cell and drag the mouse down through column E to repeat the calculation for the other dates
Next we convert the time in column C to a decimal fraction of a day The “-0.5” adjustment is needed because the Julian Day changes at midday rather than midnight
We then add together the column E and column F values to give the JD in column GThen, in column H, we calculate the number of orbits that have taken place between the Epoch Julian Date and the Julian Date of the observation
We only want to know how far we are through the latest orbitso we chop off the part before the decimal point …. and we are left with the (predicted) phase
Having completed all rows, we copy across the magnitudes from column D to column J Then highlight column I (phase) and column J (magnitude) and click on the Chart Wizard icon
Chart Wizard then asks which type of graph you want to plot.Select the XY Scatter graph …
…click on Next, add a title, click on Finish … and Excel will plot your light curve …
Unfortunately, Excel doesn’t understand Eclipsing Binaries or Magnitudes or Phases So we have some work to do to “tidy up” the light curve …
Tidying up the light curve First right click on the vertical axis and select Format Axis from the drop down menu Then adjust the settings( Minimum , Maximum , Major Step , Values in Reverse Order , at Max value , as appropriate )
Adjust the scale on the horizontal axis, and with a few more adjustments, the resulting light curve will be more like :-
Comparing observations with predictions • In the preceding light curve, primary eclipse was around phase 0.90-0.95 and secondary eclipse was near phase 0.40-0.45. • Based on the light curve alone, primary eclipse might be slightly early or might be very late • Observations over many decades tell us that the observed eclipses of beta Lyrae are now very out of step with the period in the GCVS – observed eclipses are later than predicted by more than 30 orbital periods !