Download
1 / 9
90 likes | 166 Views
Estimated Number and Proportion of AIDS Cases among. Female Adults and Adolescents, 1985–2002, United States. 16,000. 30. 25. 12,000. 20. Cases, %. Number of cases. 8,000. 15. 10. 4,000. 5. 0. 0. 1985. 1986. 1987. 1988. 1989. 1990. 1991. 1992. 1993. 1994. 1995. 1996.

E N D
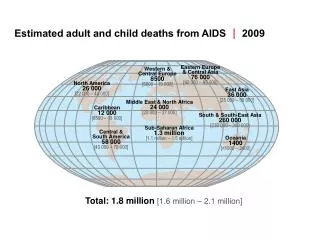
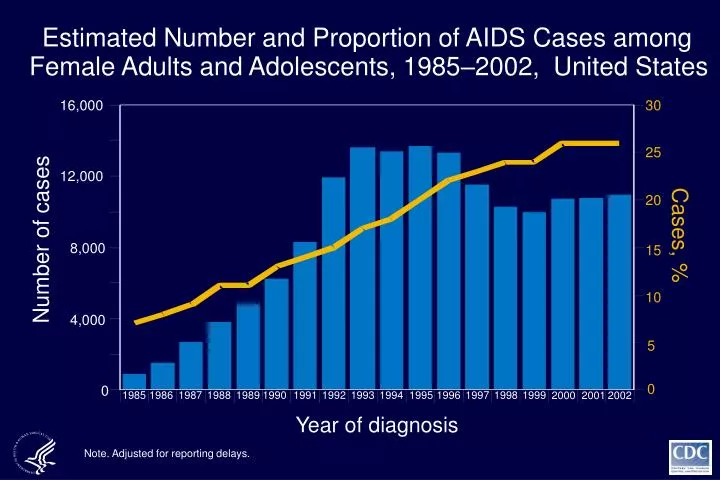
Estimated Number and Proportion of AIDS Cases among Female Adults and Adolescents, 1985–2002, United States 16,000 30 25 12,000 20 Cases, % Number of cases 8,000 15 10 4,000 5 0 0 1985 1986 1987 1988 1989 1990 1991 1992 1993 1994 1995 1996 1997 1998 1999 2000 2001 2002 Year of diagnosis Note. Adjusted for reporting delays.
Reported AIDS Cases and Rates Among Female Adults and Adolescents, by Race/Ethnicity, 2002 United States Rate (per 100,000 population) Race/Ethnicity % Number 2.2 1,928 18 White, not Hispanic 7,326 Black, not Hispanic 67 49.1 Hispanic 1,556 14 11.2 68 <1 1.3 Asian/Pacific Islander American Indian/ <1 4.4 42 Alaska Native 10,930 Total* Note. Excludes persons from US dependencies, possessions and associated nations. * Total includes 10 persons of unknown race.
Proportion of AIDS Cases among Female Adults and Adolescents, by Exposure Category, 2002 United States Sex with Heterosexual injection drug user transmission 15% 68% Sex with men of other or † unspecified risk Injection drug use 53% 29% Other/not identified** 3% Note. Data adjusted for reporting delays and for redistribution of cases in persons initially reported without an identified risk. * Includes heterosexual contact with: a bisexual, a person with hemophilia, a transfusion recipient with HIV infection or HIV-infected person, risk not specified. ** Includes hemophilia, blood transfusion, perinatal, and risk not reported or not identified.
Proportion of AIDS Cases among Female Adults and Adolescents, by Exposure Category and Age at Diagnosis, 2002, United States Age at diagnosis (in years) Exposure category 13-19 20-24 25-34 35-44 45+ % % % % % Injection drug use 14 19 24 33 31 79 61 74 65 66 Heterosexual contact Other/not identified* 2 2 3 3 25 No. of Persons (in thousands) Note. Data adjusted for reporting delays and for redistribution of cases in persons initially reported without an identified risk. * Includes hemophilia, blood transfusion, perinatal, and risk not reported or not identified.
AIDS Rates for Female Adults and Adolescents, Reported in 2002, United States 2.7 * * * * 2.6 2.1 2.5 NH * 1.5 26.7 * * 8.1 MA 4.5 RI 5.5 9.6 1.8 CT 12.7 2.5 3.2 6.0 13.2 NJ 1.1 8.8 3.3 2.5 2.5 16.6 DE 1.1 8.8 4.1 MD 27.7 3.3 2.7 DC 101.9 8.7 7.5 2.0 1.8 3.4 Rate (per 100,000 5.9 14.1 population) 5.5 11.2 10.4 <4 7.8 _ 18.9 4 9.9 10+ 20.1 2.9 No. of Persons (in thousands) 2.7 * Rates were not calculated for states that reported fewer than 5 AIDS cases in females in 2002.
Estimated Number of AIDS Cases among Female Adults and Adolescents Attributed to Injection Drug Use and Heterosexual Contact, by Region*, Cumulative through 2002 United States 40 36,941 Injection drug use N=65,394 35 33,788 Heterosexual contact N=80,677 29,487 30 Number of cases (in thousands 25 21,178 20 15 (in thousands) Number of cases 10 7,642 6,607 5,562 4,866 5 0 Midwest South West Northeast Region Note. Data adjusted for reporting delays. * Excludes persons from Puerto Rico and US dependencies, possessions and associated nations.
Reported AIDS Cases among Female Adults and Adolescents, by Region and Race/Ethnicity, 2002 United States 4,500 4,104 White, not Hispanic 4,000 Black, not Hispanic 3,500 Hispanic 3,000 2,500 2,213 Number of cases 2,000 1,500 1,000 864 763 713 563 500 363 336 296 266 229 100 0 West Northeast Midwest South N=909 N=3,665 N=1,092 N=5,264 Region* Note. Excludes persons from Puerto Rico and US dependencies, possessions and associated nations. * Region totals include females of unknown race.
333 51 16 15 2 478 7 151 22 203 70 413 7,100 23 55 40 10 913 1,293 200 10,088 20 7 601 190 176 68 89 11 1,181 121 65 227 372 1,142 2,227 570 3,835 3,065 101 1,458 77 592 341 280 3,153 137 417 1,833 634 2,355 60 158 104 895 230 1,136 436 2,807 1,048 723 1,492 468 479 158 286 325 53 80 1,030 1,667 263 1,175 1,287 1,598 498 3,340 515 N=50,595*** 2,034 3,144 1,086 Confidential 7,751 HIV Reporting* 6,819 Required Pediatric only Female Adults and Adolescents aged 15-44 Years Living with HIV Infection (not AIDS) or with AIDS, 2002 United States MA RI CT NJ DE 207 MD DC HIV AIDS N=42,047** 20 30 Guam 7 4 64 Pacific Islands, US 1 1,659 Puerto Rico 72 61 Virgin Islands, US Note. Data based on person’s age as of December 31, 2002. * Data from 30 areas that have had laws or regulations requiring confidential name-based HIV infection reporting. ** Includes 306 female adults and adolescents reported from areas with confidential name-based HIV infection reporting, but who were residents of areas without confidential name-based HIV infection reporting. Includes 99 female adults and adolescents whose state of residence is unknown or missing. *** Includes 57 female adults and adolescents whose state of residence is unknown or missing.
For free confidential testing… • Scott Co Health Dept: 428 Western Ave. Davenport; 326-8618 Wait for operator; Walk in Tues & Thurs 1-4 PM & Friday 8:30 -11. • Rock Island Co. Health Dept: 2112 25th Ave. Rock Island (309)-794-7080